Prudential 2003 Annual Report Download - page 6
Download and view the complete annual report
Please find page 6 of the 2003 Prudential annual report below. You can navigate through the pages in the report by either clicking on the pages listed below, or by using the keyword search tool below to find specific information within the annual report.-
 1
1 -
 2
2 -
 3
3 -
 4
4 -
 5
5 -
 6
6 -
 7
7 -
 8
8 -
 9
9 -
 10
10 -
 11
11 -
 12
12 -
 13
13 -
 14
14 -
 15
15 -
 16
16 -
 17
17 -
18
-
19
-
20
-
21
-
22
-
23
-
24
-
25
-
26
-
27
-
28
-
29
-
30
-
31
-
32
-
33
-
34
-
35
-
36
-
37
-
38
-
39
-
40
-
41
-
42
-
43
-
44
-
45
-
46
-
47
-
48
-
49
-
50
-
51
-
52
-
53
-
54
-
55
-
56
-
57
-
58
-
59
-
60
-
61
-
62
-
63
-
64
-
65
-
66
-
67
-
68
-
69
-
70
-
71
-
72
-
73
-
74
-
75
-
76
-
77
-
78
-
79
-
80
-
81
-
82
-
83
-
84
-
85
-
86
-
87
-
88
-
89
-
90
-
91
-
92
-
93
-
94
-
95
-
96
-
97
-
98
-
99
-
100
-
101
-
102
-
103
-
104
-
105
-
106
-
107
-
108
-
109
-
110
-
111
-
112
-
113
-
114
-
115
-
116
-
117
-
118
-
119
-
120
-
121
-
122
-
123
-
124
-
125
-
126
-
127
-
128
-
129
-
130
-
131
-
132
-
133
-
134
-
135
-
136
-
137
-
138
-
139
-
140
-
141
-
142
-
143
-
144
-
145
-
146
-
147
-
148
-
149
-
150
-
151
-
152
-
153
-
154
-
155
-
156
-
157
-
158
-
159
-
160
-
161
-
162
-
163
-
164
-
165
-
166
-
167
-
168
-
169
-
170
-
171
-
172
-
173
-
174
-
175
-
176
-
177
-
178
-
179
-
180
 |
 |

4Growing and Protecting Your Wealth
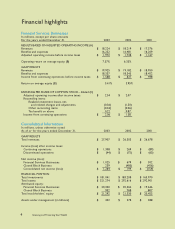
Financial highlights
Financial Services Businesses
In millions, except per share amounts
For the years ended December 31, 2003 2002 2001
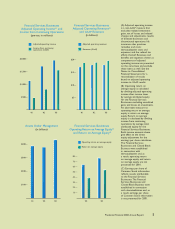
RESULTS BASED ON ADJUSTED OPERATING INCOME (A)
Revenues $ 18,224 $ 18,219 $ 17,376
Benefits and expenses 16,252 16,481 16,209
Adjusted operating income before income taxes $ 1,972 $ 1,738 $ 1,167
Operating return on average equity (B) 7.57% 6.35%
GAAP RESULTS
Revenues $ 19,925 $ 19,182 $ 18,950
Benefits and expenses 18,337 18,345 18,452
Income from continuing operations before income taxes $ 1,588 $ 837 $ 498
Return on average equity (B) 5.41% 3.95%
EARNINGS PER SHARE OF COMMON STOCK - diluted (C)
Adjusted operating income after income taxes $ 2.54 $ 2.07
Reconciling items:
Realized investment losses, net,
and related charges and adjustments (0.36) (1.50)
Other reconciling items (0.34) (0.06)
Tax benefit on above 0.22 0.87
Income from continuing operations $ 2.06 $ 1.38
Consolidated Information
In millions, unless otherwise noted
As of or for the years ended December 31, 2003 2002 2001
GAAP RESULTS
Total revenues $ 27,907 $ 26,303 $ 26,678
Income (loss) after income taxes:
Continuing operations $ 1,308 $ 269 $ (89)
Discontinued operations $ (44) $ (75) $ (65)
Net income (loss):
Financial Services Businesses $ 1,025 $ 679 $ 302
Closed Block Business 239 (485) (456)
Consolidated net income (loss) $ 1,264 $ 194 $ (154)
FINANCIAL POSITION
Total investments $ 181,041 $ 183,208 $ 165,970
Total assets $ 321,274 $ 292,616 $ 292,901
Attributed equity:
Financial Services Businesses $ 20,340 $ 20,562 $ 19,646
Closed Block Business 952 768 807
Total stockholders’ equity $ 21,292 $ 21,330 $ 20,453
Assets under management (in billions) $ 432 $ 378 $ 388