Progressive 2006 Annual Report Download - page 5
Download and view the complete annual report
Please find page 5 of the 2006 Progressive annual report below. You can navigate through the pages in the report by either clicking on the pages listed below, or by using the keyword search tool below to find specific information within the annual report.-
 1
1 -
 2
2 -
 3
3 -
 4
4 -
 5
5 -
 6
6 -
 7
7 -
 8
8 -
 9
9 -
 10
10 -
 11
11 -
 12
12 -
 13
13 -
 14
14 -
 15
15 -
 16
16 -
17
-
18
-
19
-
20
-
21
-
22
-
23
-
24
-
25
-
26
-
27
-
28
-
29
-
30
-
31
-
32
-
33
-
34
-
35
-
36
-
37
 |
 |

(billions
—
except shares outstanding, per share amounts and policies in force)
1
(billions
—
except per share amounts)
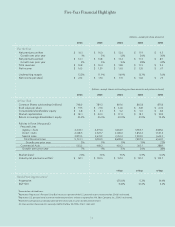
Five-Year Financial Highlights
2006 2005 2004 2003 2002
For the Year
Net premiums written $ 14.1 $ 14.0 $ 13.4 $ 11.9 $ 9.5
Growth over prior year 1% 5% 12% 26% 30%
Net premiums earned $ 14.1 $ 13.8 $ 13.2 $ 11.3 $ 8.9
Growth over prior year 3% 5% 16% 28% 24%
Total revenues $ 14.8 $ 14.3 $ 13.8 $ 11.9 $ 9.3
Net income $1.65 $1.39 $1.65 $1.26 $ .67
Underwriting margin 13.3% 11.9% 14.9% 12.7% 7.6%
Net income per share1$2.10 $1.74 $ 1.91 $1.42 $ .75
2006 2005 2004 2003 2002
At Year-End
Common Shares outstanding (millions) 748.0 789.3 801.6 865.8 871.8
Book value per share $ 9.15 $ 7.74 $ 6.43 $ 5.81 $ 4.32
Consolidated shareholders’ equity $ 6.8 $ 6.1 $ 5.2 $ 5.0 $ 3.8
Market capitalization $ 18.1 $ 23.0 $ 17.0 $ 18.1 $ 10.8
Return on average shareholders’ equity 25.3% 25.0% 30.0% 29.1% 19.3%
Policies in Force (thousands)
Personal Lines
Agency
—
Auto 4,433.1 4,491.4 4,244.9 3,965.7 3,385.6
Direct
—
Auto 2,428.5 2,327.7 2,084.1 1,852.2 1,541.3
Special Lines 2,879.5 2,674.9 2,351.3 1,990.0
1,642.2
Total Personal Lines 9,741.1 9,494.0 8,680.3 7,807.9 6,569.1
Growth over prior year 3% 9% 11% 19% 22%
Commercial Auto 503.2 468.2 420.2 365.1 288.9
Growth over prior year 7% 11% 15% 26% 38%
Market share27.6% 7.6% 7.5% 6.9% 6.0%
Industry net premiums written3$161.1 $ 159.5 $ 157.3 $ 151.2 $ 139.7
1-Year 3-Year 5-Year
Stock Price Appreciation4
Progressive (17.0)% 5.2% 14.4%
S&P 500 15.8% 10.4% 6.2%
1Presented on a diluted basis.
2Represents Progressive’s Personal Lines Businesses as a percent of the U.S. personal auto insurance market; 2006 is estimated.
3Represents U.S. personal auto insurance market net premiums written as reported by A.M. Best Company, Inc.; 2006 is estimated.
4Represents average annual compounded rate of increase and assumes dividend reinvestment.
All share and per share amounts were adjusted for the May 18, 2006, 4-for-1 stock split.