Progress Energy 2008 Annual Report Download - page 12
Download and view the complete annual report
Please find page 12 of the 2008 Progress Energy annual report below. You can navigate through the pages in the report by either clicking on the pages listed below, or by using the keyword search tool below to find specific information within the annual report.-
 1
1 -
 2
2 -
 3
3 -
 4
4 -
 5
5 -
 6
6 -
 7
7 -
 8
8 -
 9
9 -
 10
10 -
 11
11 -
 12
12 -
 13
13 -
 14
14 -
 15
15 -
 16
16 -
 17
17 -
 18
18 -
 19
19 -
 20
20 -
 21
21 -
 22
22 -
23
-
24
-
25
-
26
-
27
-
28
-
29
-
30
-
31
-
32
-
33
-
34
-
35
-
36
-
37
-
38
-
39
-
40
-
41
-
42
-
43
-
44
-
45
-
46
-
47
-
48
-
49
-
50
-
51
-
52
-
53
-
54
-
55
-
56
-
57
-
58
-
59
-
60
-
61
-
62
-
63
-
64
-
65
-
66
-
67
-
68
-
69
-
70
-
71
-
72
-
73
-
74
-
75
-
76
-
77
-
78
-
79
-
80
-
81
-
82
-
83
-
84
-
85
-
86
-
87
-
88
-
89
-
90
-
91
-
92
-
93
-
94
-
95
-
96
-
97
-
98
-
99
-
100
-
101
-
102
-
103
-
104
-
105
-
106
-
107
-
108
-
109
-
110
-
111
-
112
-
113
-
114
-
115
-
116
-
117
-
118
-
119
-
120
-
121
-
122
-
123
-
124
-
125
-
126
-
127
-
128
-
129
-
130
-
131
-
132
-
133
-
134
-
135
-
136
-
137
-
138
-
139
-
140
-
141
-
142
-
143
-
144
-
145
-
146
-
147
-
148
-
149
-
150
-
151
-
152
-
153
-
154
-
155
-
156
-
157
-
158
-
159
-
160
-
161
-
162
-
163
-
164
-
165
-
166
-
167
-
168
-
169
-
170
-
171
-
172
-
173
-
174
-
175
-
176
-
177
-
178
-
179
-
180
-
181
-
182
-
183
-
184
-
185
-
186
-
187
-
188
-
189
-
190
-
191
-
192
-
193
-
194
-
195
-
196
-
197
-
198
-
199
-
200
-
201
-
202
-
203
-
204
-
205
-
206
-
207
-
208
-
209
-
210
-
211
-
212
-
213
-
214
-
215
-
216
-
217
-
218
-
219
-
220
-
221
-
222
-
223
-
224
-
225
-
226
-
227
-
228
-
229
-
230
-
231
-
232
-
233
 |
 |

MANAGEMENT’S DISCUSSION AND ANALYSIS
10
Overview
FOR 2008 AS COMPARED TO 2007 AND 2007 AS COMPARED
TO 2006
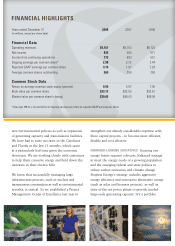
For the year ended December 31, 2008, our net income
was $830 million, or $3.19 per share, compared to
$504 million, or $1.97 per share, for the same period in
2007. For the year ended December 31, 2008, our income
from continuing operations was $773 million compared to
$693 million for the same period in 2007. The increase in
income from continuing operations as compared to prior
year was due primarily to:
• favorableallowanceforfundsusedduringconstruction
(AFUDC) at the Utilities;
• increasedretailbaseratesatPEF;
• higherwholesalerevenuesatPEF;
• lowerpurchasedpowercapacitycostsatPECdueto
the expiration of a power buyback agreement; and
• favorablenetretailcustomergrowthandusageatPEC.
Partially offsetting these items were:
• higherinterestexpenseatPEF;
• higherincometaxexpenseduetothebenetfromthe
closure of certain federal tax years and positions in
2007;
• unfavorable net retail customer growth and usage
at PEF;
• unfavorableweatheratPEC;
• higherinvestmentlossesofcertainemployeebenet
trusts at PEF and Corporate and Other resulting from
the decline in market conditions; and
• higherdepreciationandamortizationexpenseatPEF
excluding prior year recoverable storm amortization
at PEF.
For the year ended December 31, 2007, our net income
was $504 million, or $1.97 per share, compared to
$571 million, or $2.28 per share, for the same period in
2006. For the year ended December 31, 2007, our income
from continuing operations was $693 million compared to
$551 million for the same period in 2006. The increase in
income from continuing operations as compared to prior
year was due primarily to:
• lower North Carolina Clean Smokestacks Act (Clean
Smokestacks Act) amortization expense at PEC;
• lowerinterestexpenseattheParentduetoreducing
debt in late 2006;
• thecostincurredtoredeemdebtattheParentin2006;
• favorableweatheratPEC;
• lowerallocationsofcorporateoverheadtocontinuing
operations as a result of the 2006 divestitures;
• unrealized losses recorded on contingent value
obligations (CVOs) during 2006;
• favorableAFUDCequityattheUtilities;
• favorablenetretailcustomergrowthandusageatthe
Utilities; and
• higherwholesalerevenuesatPEF.
Partially offsetting these items were:
• higher operation and maintenance (O&M) expenses
at the Utilities primarily due to higher plant outage and
maintenance costs and higher employee benefits;
• additional depreciation expense associated with
PEC’s accelerated cost-recovery program for nuclear
generation assets (See Note 7B);
• higherinterestexpenseatPEF;
• the impact of the 2006 gain on sale of Level 3
Communications, Inc. stock acquired as part of the
divestiture of Progress Telecom, LLC (PT LLC); and
• higher other operating expenses due to disallowed
fuel costs at PEF.
Our segments contributed the following profit or loss
from continuing operations:
(in millions) 2008 Change 2007 Change 2006
PEC $531 $33 $498 $44 $454
PEF 383 68 315 (11) 326
Total segment profit 914 101 813 33 780
Corporate and Other (141) (21) (120) 109 (229)
Total income from
continuing operations 773 80 693 142 551
Discontinued operations,
net of tax 57 246 (189) (209) 20
Net income $830 $326 $504 $(67) $571
Progress Energy Carolinas
PEC contributed segment profits of $531 million,
$498 million and $454 million in 2008, 2007 and 2006,
respectively. The increase in profits for 2008 as
compared to 2007 is primarily due to lower purchased
power capacity costs due to the expiration of a power
buyback agreement, favorable AFUDC and favorable
net retail customer growth and usage, partially offset
by the unfavorable impact of weather and lower excess
generation revenues.