Principal Financial Group 2014 Annual Report Download - page 9
Download and view the complete annual report
Please find page 9 of the 2014 Principal Financial Group annual report below. You can navigate through the pages in the report by either clicking on the pages listed below, or by using the keyword search tool below to find specific information within the annual report.-
 1
1 -
 2
2 -
 3
3 -
 4
4 -
 5
5 -
 6
6 -
 7
7 -
 8
8 -
 9
9 -
 10
10 -
 11
11 -
 12
12 -
 13
13 -
 14
14 -
 15
15 -
 16
16 -
 17
17 -
 18
18 -
 19
19 -
 20
20 -
21
-
22
-
23
-
24
-
25
-
26
-
27
-
28
 |
 |

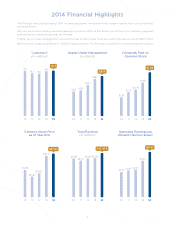
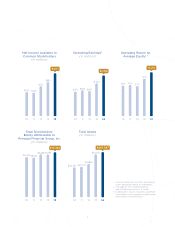
$880
$774
$605
$620
10 11 12 13 14
$1,111
$1,060
$809
$829
$793
10 11 12 13 14
$1,318
12.1%
9.7%
10.1%
9.9%
10 11 12 13 14
14.2%
Net Income Available to
Common Stockholders
(in millions)
Operating Earnings2
(in millions)
Total Assets
(in millions)
Operating Return on
Average Equity2,3
Total Stockholders’
Equity Attributable to
Principal Financial Group, Inc.
(in millions)
$9,684
$9,683
$8,952
$9,090
10 11 12 13 14
$10,184
$208,191
$161,830
$147,272
$144,591
10 11 12 13 14
$219,087
1. Includes employees and their dependents
under employee benefit arrangements.
2. See page 24 for a reconciliation of
non-GAAP measures to U.S. GAAP.
3. Stockholders’ equity available to common
stockholders excluding accumulated other
comprehensive income (loss).
7