Popeye's 2011 Annual Report Download - page 10
Download and view the complete annual report
Please find page 10 of the 2011 Popeye's annual report below. You can navigate through the pages in the report by either clicking on the pages listed below, or by using the keyword search tool below to find specific information within the annual report.-
 1
1 -
 2
2 -
 3
3 -
 4
4 -
 5
5 -
 6
6 -
 7
7 -
 8
8 -
 9
9 -
 10
10 -
 11
11 -
 12
12
 |
 |

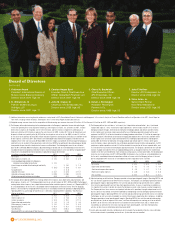
1. Krishnan Anand
President: International Division of
Molson Coors Brewing Company
Director since: 2010 Age: 54
2. R. William Ide, III
Partner: McKenna Long &
Aldridge, LLP
Director since: 2001 Age: 71
3. Carolyn Hogan Byrd
Founder, Chair & Chief Executive
Officer: GlobalTech Financial, LLC
Director since: 2001 Age: 63
4. John M. Cranor, III
Chairman: AFC Enterprises, Inc.
Director since: 2006 Age: 65
5. Cheryl A. Bachelder
Chief Executive Officer:
AFC Enterprises, Inc.
Director since: 2006 Age: 55
6. Kelvin J. Pennington
President: Pennington
Partners & Co.
Director since: 1996 Age: 53
7. John F. Hoffner
Director: AFC Enterprises, Inc.
Director since: 2006 Age: 64
8. Victor Arias, Jr.
Senior Client Partner:
Korn/Ferry International
Director since: 2001 Age: 55
Board of Directors
[Left to right]
(1) Additional information concerning financial performance can be found in AFC’s Consolidated Financial Statements and Management’s Discussion & Analysis of Financial Condition and Results of Operations in the 2011 Annual Report on
Form 10-K, including, without limitations, information in Item 7 of the Annual Report related to total revenues.
(2) Weighted average common shares for the computation of diluted earnings per common share were 25.0 million, 25.5 million and 25.4 million for 2011, 2010 and 2009, respectively.
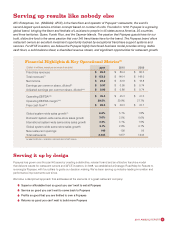
(Dollars in millions) 2011 2010 2009
Net income $ 24.2 $ 22.9 $ 18.8
Depreciation and amortization $ 4.2 $ 3.9 $ 4.4
Stock-based compensation expense $ 2.9 $ 2.7 $ 1.9
Maintenance capital expenses $ (2.8) $ (3.2) $ (1.4)
Free cash flow $ 28.5 $ 26.3 $ 23.7
(Dollars in millions) 2011 2010 2009
Net income $ 24.2 $ 22.9 $ 18.8
Interest expense, net $ 3.7 $ 8.0 $ 8.4
Income tax expense $ 12.8 $ 10.3 $ 11.5
Depreciation and amortization $ 4.2 $ 3.9 $ 4.4
Other expenses (income), net $ 0.5 $ 0.2 $ (2.1)
Operating EBITDA $ 45.4 $ 45.3 $ 41.0
Total Revenues $ 153.8 $ 146.4 $ 148.0
Operating EBITDA as a percentage of Total Revenues 29.5% 30.9% 27.7%
(In millions, except per share data) 2011 2010 2009
Net income $ 24.2 $ 22.9 $ 18.8
Other expenses (income), net $ 0.5 $ 0.2 $ (2.1)
Accelerated depreciation related to the Company’s
relocation to a new Global Service Center $ 0.5 — —
Interest charges associated with refinancing of credit facility — $ 0.6 $ 1.9
Tax effect $ (0.5) $ (0.3) $ 0.1
Tax audit benefit — $ (1.4) —
Adjusted net income $ 24.7 $ 22.0 $ 18.7
Adjusted earnings per diluted share $ 0.99 $ 0.86 $ 0.74
Weighted average diluted shares outstanding 25.0 25.5 25.4
(6) Adjusted earnings per diluted share, Company-operated restaurant operating profit margins, Operating EBITDA, and
free cash flow are supplemental non-GAAP financial measures. The Company uses Company-operated restaurant
operating profit margins, Operating EBITDA, free cash flow and adjusted earnings per diluted share, in addition
to net income, operating profit and cash flows from operating activities, to assess its performance and believes
it is important for investors to be able to evaluate the Company using the same measures used by management.
The Company believes these measures are important indicators of its operational strength and performance of its
business because they provide a link between profitability and operating cash flow. Company-operated restaurant
operating profit margins, Operating EBITDA, free cash flow and adjusted earnings per diluted share as calculated by
the Company are not necessarily comparable to similarly titled measures reported by other companies. In addition,
Company-operated restaurant operating profit margins, Operating EBITDA, free cash flow and adjusted earnings
per diluted share: (a) do not represent net income, cash flows from operations or earnings per share as defined
by GAAP; (b) are not necessarily indicative of cash available to fund cash flow needs; and (c) should not be
considered as an alternative to net income, earnings per share, operating profit, cash flows from operating
activities or other financial information determined under GAAP.
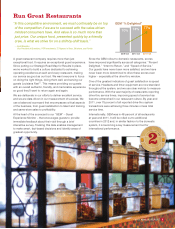
(7) System-wide sales growth calculates combined sales of all restaurants that we operate or franchise. Sales information
for franchised restaurants is provided by our franchisees. System-wide sales are unaudited.
(4) The Company defines Operating EBITDA as “earnings before interest expense, taxes, depreciation and amortization, and
other expenses (income), net”. The following table reconciles on a historical basis for 2011, 2010 and 2009, the Company’s
earnings before interest expense, taxes, depreciation and amortization, and other expenses (income), net (“Operating EBITDA”)
on a consolidated basis to the line on its consolidated statement of operations entitled net income, which the Company
believes is the most directly comparable GAAP measure on its consolidated statement of operations to Operating EBITDA.
“Operating EBITDA as a percentage of Total Revenues” is defined as “Operating EBITDA” divided by “Total Revenues”.
(5) The Company defines free cash flow as “net income” plus “depreciation and amortization”, plus “stock-based
compensation expense”, minus “maintenance capital expenditures” (which includes: for 2011, $1.5 million in
Company restaurant reimages, $0.8 million of information technology hardware and software, and $0.5 million
in other capital assets to maintain, replace and extend the lives of Company-operated restaurant facilities and
equipment; for 2010, $1.4 million for information technology hardware and software, $1.2 million for reopening a
Company restaurant in New Orleans and restaurant reimaging and corporate office construction, and $0.6 million
in other capital assets to maintain, replace and extend the lives of Company-operated facilities and equipment;
and for 2009, $0.3 million for information technology hardware and software and $1.1 million in other capital
assets to maintain, replace and extend the lives of Company-operated restaurant facilities and equipment). In 2011,
maintenance capital expenditures exclude $3.3 million related to the construction of the new corporate office, and
$1.5 million for the construction of new Company-operated restaurants. The Company’s definition of free cash flow
has been changed to exclude the effects of mandatory debt payments as management believes the new definition
conforms to the free cash flow definition more commonly used by analysts, investors and lenders. The following table
reconciles on a historical basis for 2011, 2010 and 2009, the Company’s free cash flow on a consolidated basis to
the line on its consolidated statement of operations entitled net income, which the Company believes is the most
directly comparable GAAP measure on its consolidated statement of operations to free cash flow:
(3) The Company defines adjusted earnings for the periods presented as the Company’s reported net income after adjusting for
certain non-operating items consisting of the following: (i) other expense (income), net, as follows: for 2011, includes
$0.8 million in expenses for the global service center relocation, and $0.5 million in impairments and disposals of
fixed assets offset by a $0.8 million net gain on the sale of assets; for 2010, includes $0.7 million for impairments and
disposals of fixed assets partially offset by $0.5 million for net gain on sales of assets; for 2009, includes $3.3 million
on the sale of assets partially offset by $0.6 million related to impairments and disposals of fixed assets and $0.6 million
of other expense; (ii) for fiscal 2011, $0.5 million in accelerated depreciation related to the Company’s relocation to a new
corporate service center; (iii) fiscal years 2010 and 2009, the interest charges associated with the refinancing of the Company’s
credit facility; (iv) the tax effect of these adjustments; and (v) for fiscal 2010 the tax audit benefit. Adjusted earnings per diluted
share provides the per share effect of adjusted net income on a diluted basis. The following table reconciles on a historical
basis for 2011, 2010 and 2009, the Company’s adjusted earnings per diluted share on a consolidated basis to the line on its
consolidated statement of operations entitled net income, which the Company believes is the most directly comparable GAAP
measure on its consolidated statement of operations to adjusted earnings per diluted share:
8AFC ENTERPRISES, INC.