Popeye's 2010 Annual Report Download - page 9
Download and view the complete annual report
Please find page 9 of the 2010 Popeye's annual report below. You can navigate through the pages in the report by either clicking on the pages listed below, or by using the keyword search tool below to find specific information within the annual report.-
 1
1 -
 2
2 -
 3
3 -
 4
4 -
 5
5 -
 6
6 -
 7
7 -
 8
8 -
 9
9 -
 10
10 -
 11
11
 |
 |

AFC ENTERPRISES, INC.
8
Design: Eisenman Associates. Copywriting: Amy Binder. Photography: Gregory Benson, Grover Sterling. Printing: Earth Thebault, RR Donnelley.
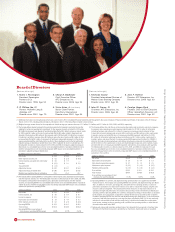
1. Kelvin J. Pennington
President: Pennington
Partners & Co.
Director since: 1996 Age: 52
2. R. William Ide, III
Partner: McKenna Long &
Aldridge, LLP
Director since: 2001 Age: 70
3. Cheryl A. Bachelder
Chief Executive Officer:
AFC Enterprises, Inc.
Director since: 2006 Age: 54
4. Victor Arias, Jr. (not shown)
Senior Client Partner:
Korn/Ferry International
Director since: 2001 Age: 54
1. Krishnan Anand
President: International Division of
Molson Coors Brewing Company
Director since: 2010 Age: 53
2. John M. Cranor, III
Chairman: AFC Enterprises, Inc.
Director since: 2006 Age: 64
3. John F. Hoffner
Director: AFC Enterprises, Inc.
Director since: 2006 Age: 63
4. Carolyn Hogan Byrd
Founder, Chair & Chief Executive
Officer: GlobalTech Financial, LLC
Director since: 2001 Age: 62
Board of Directors
[Back row, left to right] [Front row, left to right]
(1)AdditionalinformationconcerningfinancialperformancecanbefoundinAFC’sConsolidatedFinancialStatementsandManagement’sDiscussion&AnalysisofFinancialConditionandResultsofOperationsinthe2010Annual
ReportonForm10-K,including,withoutlimitations,informationinItem7oftheAnnualReportrelatedtototalrevenues.
(2)Weightedaveragecommonsharesforthecomputationofdilutedearningspercommonsharewere25.5million,25.4million,and25.7millionfor2010,2009,and2008,respectively.
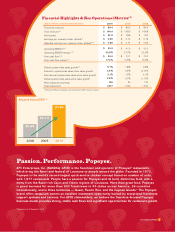
(Dollarsinmillions) 2010 2009 2008
Netincome $22.9 $ 18.8 $ 19.4
Depreciationandamortization $ 3.9 $ 4.4 $ 6.3
Stock-basedcompensationexpense $ 2.7 $ 1.9 $ 2.5
Maintenancecapitalexpenses $ (3.2) $ (1.4) $ (2.0)
Mandatorydebtpayments $ (1.0) $ (1.6) $ (4.2)
Freecashflow $25.3 $ 22.1 $ 22.0
Totalrevenues $146.4 $148.0 $166.8
Freecashflowasapercentageoftotal
revenues(freecashflowmargin) 17.3% 14.9% 13.2%
(Inmillions,exceptpersharedata) 2010 2009 2008
Netincome $22.9 $ 18.8 $ 19.4
Otherexpenses(income),net $ 0.2 $ (2.1) $ (4.6)
Interestexpenseassociatedwithcreditfacility $ 0.6 $ 1.9 —
Taxeffect $ (0.3) $ 0.1 $ 2.0
Taxauditbenefit $ (1.4) — —
Adjustednetincome $22.0 $ 18.7 $ 16.8
Adjustedearningsperdilutedshare $0.86 $ 0.74 $ 0.65
Weighted-averagedilutedsharesoutstanding 25.5 25.4 25.7
(Dollarsinmillions) 2010 2009 2008
Netincome $22.9 $ 18.8 $ 19.4
Interestexpense,net $ 8.0 $ 8.4 $ 8.1
Incometaxexpense $10.3 $ 11.5 $ 12.8
Depreciationandamortization $ 3.9 $ 4.4 $ 6.3
Otherexpenses(income),net $ 0.2 $ (2.1) $ (4.6)
OperatingEBITDA $45.3 $ 41.0 $ 42.0
Totalrevenues $146.4 $148.0 $166.8
OperatingEBITDAasapercentageof
totalrevenues(operatingEBITDAmargin) 30.9% 27.7% 25.2%
(6)OperatingEBITDA,freecashflow,andadjustedearningsperdilutedsharearesupplementalnon-GAAP
financialmeasures.TheCompanyusesoperatingEBITDA,freecashflow,andadjustedearningsperdiluted
share,inadditiontonetincome,operatingprofit,andcashflowsfromoperatingactivities,toassessits
performanceandbelievesitisimportantforinvestorstobeabletoevaluatetheCompanyusingthesame
measuresusedbymanagement.TheCompanybelievesthesemeasuresareimportantindicatorsofits
operationalstrengthandperformanceofitsbusinessbecausetheyprovidealinkbetweenprofitabilityand
operatingcashflow.OperatingEBITDA,freecashflow,andadjustedearningsperdilutedshareascalculated
bytheCompanyarenotnecessarilycomparabletosimilarlytitledmeasuresreportedbyothercompanies.
Inaddition,operatingEBITDA,freecashflow,andadjustedearningsperdilutedshare:(a)donotrepresent
netincome,cashflowsfromoperations,orearningspershareasdefinedbyGAAP;(b)arenotnecessarily
indicativeofcashavailabletofundcashflow,needs;and(c)shouldnotbeconsideredasanalternative
tonetincome,earningspershare,operatingprofit,cashflowsfromoperatingactivities,orotherfinancial
informationdeterminedunderGAAP.
(7)System-widesalesgrowthcalculatescombinedsalesofallrestaurantsthatweoperateorfranchise.Sales
informationforfranchisedrestaurantsisprovidedbyourfranchisees.System-widesalesareunaudited.
(4)TheCompanydefinesoperatingEBITDAas“earningsbeforeinterestexpense,taxes,depreciationandamortization,
andotherexpenses(income),net.”Thefollowingtablereconcilesonahistoricalbasisfor2010,2009,and2008,
theCompany’searningsbeforeinterestexpense,taxes,depreciationandamortization,andotherexpenses
(income),net(“operatingEBITDA”)onaconsolidatedbasistothelineonitsconsolidatedstatementofoperations
entitlednetincome,whichtheCompanybelievesisthemostdirectlycomparableGAAPmeasureonitsconsolidated
statementofoperationstooperatingEBITDA:
(5)TheCompanydefinesfreecashflowasnetincomeplusdepreciationandamortization,plusstockcompensa-
tionexpense,minusmaintenancecapitalexpenses(whichinclude:for2010$1.4millionforinformation
technologyhardwareandsoftware,$1.2millionforreopeningacompany-operatedrestaurantinNew
Orleansandrestaurantreimagingandcorporateofficeconstruction,and$0.6millioninothercapitalassets
tomaintain,replace,andextendthelivesofcompany-operatedQSRequipmentandfacilities;for2009
$0.3millionforinformationtechnologyhardwareandsoftwareand$1.1millioninothercapitalassetsto
maintain,replace,andextendthelivesofcompany-operatedQSRequipmentandfacilities;for2008$0.4
millionforinformationtechnologyhardwareandsoftwareincludingnewrestaurantsitemodelingsoftware
and$1.6millioninothercapitalassetstorepairandrebuilddamagedrestaurantsandtomaintain,replace,
andextendthelivesofcompany-operatedQSRequipmentandfacilities),minusmandatorydebtpayments.
Thefollowingtablereconcilesonahistoricalbasisfor2010,2009,and2008,theCompany’sfreecash
flowonaconsolidatedbasistothelineonitsconsolidatedstatementofoperationsentitlednetincome,
whichtheCompanybelievesisthemostdirectlycomparableGAAPmeasureonitsconsolidatedstatementof
operationstofreecashflow:
(3)TheCompanydefinesadjustedearningsfortheperiodspresentedastheCompany’sreportednetincomeafter
adjustingforcertainnon-operatingitemsconsistingof(i)otherexpenses(income),net(whichfor2010include
$0.7millionforimpairmentsanddisposalsoffixedassetspartiallyoffsetby$0.5millionfornetgainonsalesofassets;
for2009include$3.3milliononthesaleofassetspartiallyoffsetby$0.6millionrelatedtoimpairmentsand
disposalsoffixedassetsand$0.6millionofotherexpense;andfor2008include$12.9millionfromrecoveries
fromdirectorsandofficersinsuranceclaims,$0.9millioningainonthesaleofassets,and$0.3millionofother
incomepartiallyoffsetby$9.5millionofimpairmentsoffixedassetsandgoodwillimpairment),(ii)theinterest
expenseassociatedwiththecreditfacility,(iii)thetaxeffectoftheseadjustments,and(iv)thetaxauditbenefit.
Adjustedearningsperdilutedshareprovidethepershareeffectofadjustednetincomeonadilutedbasis.The
followingtablereconcilesonahistoricalbasisfor2010,2009,and2008,theCompany’sadjustedearningsper
dilutedshareonaconsolidatedbasistothelineonitsconsolidatedstatementofoperationsentitlednetincome,
whichtheCompanybelievesisthemostdirectlycomparableGAAPmeasureonitsconsolidatedstatementof
operationstoadjustedearningsperdilutedshare: