Popeye's 2005 Annual Report Download - page 10
Download and view the complete annual report
Please find page 10 of the 2005 Popeye's annual report below. You can navigate through the pages in the report by either clicking on the pages listed below, or by using the keyword search tool below to find specific information within the annual report.-
 1
1 -
 2
2 -
 3
3 -
 4
4 -
 5
5 -
 6
6 -
 7
7 -
 8
8 -
 9
9 -
 10
10 -
 11
11 -
 12
12
 |
 |

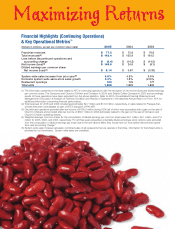
(Dollars in millions, except per common share data) 2005 2004 2003
Franchise revenues $ 77.5 $ 72.8 $ 70.8
Total revenues(2) $ 143.4 $ 163.9 $ 161.5
Loss before discontinued operations and
accounting change $ (8.4) $ (14.3) $ (14.5)
Net income (loss)(3) $ 149.6 $ 24.6 $ (9.1)
Diluted earnings per common share:
Net income (loss)(4) $ 5.14 $ 0.87 $ (0.33)
System-wide sales increase from prior year(5) 4.8% 4.5% 3.6%
Domestic system-wide same-store sales growth 3.3% 1.3% (2.6)%
Restaurant openings 123 109 177
Total units 1,828 1,825 1,806
(1) The information presented in the table relates to AFC’s continuing operations with the exception of net income (loss) and diluted earnings
per common share. The Company sold Church’s Chicken and Cinnabon in 2004, and Seattle Coffee Company in 2003 and accordingly,
results of those operations have been excluded from the above statistics. Refer to AFC’s Consolidated Financial Statements and
Management’s Discussion & Analysis of Financial Condition and Results of Operations in the attached Annual Report on Form 10-K for
additional information concerning financial performance.
(2) Total revenues for 2005 and 2004 included approximately $2.7 million and $12.6 million, respectively, in sales related to Popeyes fran-
chisees that were consolidated as part of AFC’s adoption of FIN 46R.
(3) Discontinued operations provided after-tax income of $158.0 million during 2005 (all of which was associated with a gain on the sale of
Church’s Chicken) and provided after-tax income of $39.1 million in 2004 (principally related to the gain on the sale of Cinnabon and
Church’s Chicken operating results).
(4) Weighted average common shares for the computation of diluted earnings per common share were 29.1 million, 28.1 million, and 27.8
million for 2005, 2004, and 2003, respectively. For all three years presented, potentially dilutive employee stock options were excluded
from the computation of dilutive earnings per share due to the anti-dilutive effect they would have on “loss before discontinued opera-
tions and accounting change.”
(5) System-wide sales increase calculates combined sales of all restaurants that we operate or franchise. Information for franchised units is
provided by our franchisees. System-wide sales are unaudited.
Financial Highlights (Continuing Operations)
& Key Operational Metrics(1)
Maximizing Returns
8