Peachtree 2006 Annual Report Download
Download and view the complete annual report
Please find the complete 2006 Peachtree annual report below. You can navigate through the pages in the report by either clicking on the pages listed below, or by using the keyword search tool below to find specific information within the annual report.-
 1
1 -
 2
2 -
 3
3 -
 4
4 -
 5
5 -
 6
6 -
 7
7 -
 8
8 -
 9
9 -
 10
10 -
 11
11 -
 12
12 -
13
-
14
-
15
-
16
-
17
-
18
-
19
-
20
-
21
-
22
-
23
-
24
-
25
-
26
-
27
-
28
-
29
-
30
-
31
-
32
-
33
-
34
-
35
-
36
-
37
-
38
-
39
-
40
-
41
 |
 |

Results for the year ended
30 September 2006
Table of contents
-
Page 1
Results for the year ended 30 September 2006 -
Page 2
Agenda Overview of the year Financial and regional review Business review and outlook 2 -
Page 3
... of the year • • • 2006 strong year, in both existing business and recently acquired businesses Strong organic growth of 7%, recovered in H2 to 8% Strong performance by established product lines - Line 50 (UK) up 13% - Line 100 (France) up 11% - MAS 500 (US) up 17% • Newer products and... -
Page 4
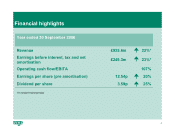
Financial highlights Year ended 30 September 2006 Revenue Earnings before interest, tax and net amortisation Operating cash flow/EBITA Earnings per share (pre amortisation) Dividend per share *At constant exchange rates £935.6m £249.3m 22%* 23%* 107% 12.54p 3.59p 20% 25% 4 -
Page 5
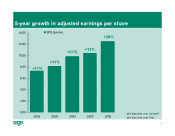
5-year growth in adjusted earnings per share 14.00 EPS (pence) +20% 12.00 +21% 10.00 +13% +11% 8.00 +11% 6.00 4.00 2.00 0.00 2002 2003 2004 2005 2006 EPS 2002-2004 under UK GAAP EPS 2005-2006 under IFRS 5 -
Page 6
... and Constructor Anywhere Bäurer UBS Elit Emdeon Smaller acquisitions Total enterprise value Industry Real estate/ manufacturing Merchant services Construction Manufacturing Business management/accounting Food distribution/ transport Health care Country France US US Germany Malaysia France US... -
Page 7
Financial review -
Page 8
Organic revenue growth • • • Improved growth rate over last 2 years Excludes strong contribution from 2005 and 2006 acquisitions Acquisitions consolidated into organic growth after full year contribution £1,000m £900m £800m £700m £600m £500m £400m Organic Non-core Acquisitions / ... -
Page 9
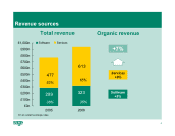
Revenue sources Total revenue £1,000m £900m £800m £700m £600m £500m £400m £300m £200m £100m £0m 2005 £m at constant exchange rates Organic revenue +7% 613 Software Services 477 62% 65% Services +8% 289 38% 323 35% 2006 Software +5% 9 -
Page 10
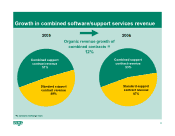
Growth in combined software/support services revenue 2005 Organic revenue growth of combined contracts = 2006 12% Combined support contract revenue 51% Combined support contract revenue 53% Standard support contract revenue 49% Standard support contract revenue 47% *At constant exchange rates 10 -
Page 11
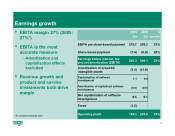
... 203.3 2006 % £m growth 258.2 (8.9) 249.3 23% 20% 23% (3.3) (13.6) 1.1 (0.6) 0.9 (0.8) • Revenue growth and product and service investments both drive margin Net capitalisation of software development Forex 0.5 (1.2) 199.3 0.1 235.8 18% 11 *At constant exchange rates Operating profit -
Page 12
...+24% £29m à £33m 2005 à £9m 2006 2005 2006 2006 France November 2005 Enterprise value £75m EBITA margin 18%* *post acquisition £m at constant exchange rates US February 2006 Enterprise value £171m EBITA margin 39%* US September 2006 Enterprise value £306m EBITA margin 11%* Revenue... -
Page 13
... / amortisation Profit on disposal Stock compensation Working capital change Deferred income change Exchange differences Cash flow from operations Cash:profit conversion 249.3 16.4 (2.7) 8.9 Cash flow from operations Interest Tax Dividends 267.1 (14.0) (60.3) (39.1) Net debt 30/09/05 Free cash... -
Page 14
Regional review -
Page 15
... PERU BOLIVIA ZIMBABWE NAMIBIA PARAGUAY BOTSWANA ANGOLA ZAMBIA ZA M BIQ UE MADAGASCAR M O URUGUAY CHILE ARGENTINA SOUTH AFRICA AUSTRALIA NEW ZEALAND • • 23,000 business partners and certified consultants promoting our products 40,000 professional advisors recommending Sage product 15 -
Page 16
Organic revenue H1 vs H2 % growth on prior year at constant exchange rates H1 H2 20% 15% 10% 5% 4% 0% 9% 6% 3% 4% 7% 14% 19% 5% 8% UK Mainland Europe North America Rest of World Total Full year 7% 5% 6% 17% 7% 16 -
Page 17
...growth in established products • • Line 50 up 13% Line 1000, Start-up - introduction of new products - focus on integrated product suites - successful combination of software/support contracts £193m £205m • EBITA margin 37% (2005: 37%) 37% margin 2005 Revenue 37% margin 2006 EBITA 17 -
Page 18
... Europe • Organic revenue +5% - Spain +10% - France +4% - Germany/Switzerland +2% • • • Poland +15% (y-o-y) Strong growth in CRM and industryspecific products EBITA margin 22% (2005: 22%) £204m £300m 22% margin 2005 Revenue 22% margin 2006 EBITA At constant exchange rates 18 -
Page 19
... America Organic revenue +6% - recovery in H2 Small Business Division +10% - strong contribution from all products - Peachtree, Simply, ACT! had a particularly strong year £312m £362m Mid-Market Division +4% - good performance from MAS 500 and ACCPAC products EBITA margin 24% (2005: 24... -
Page 20
Rest of World • Organic revenue +17% - strong performances from South African accounting and payroll products - Australia core products again strong - growing presence in new markets £58m £69m • EBITA margin 27% (2005: 24%) - growth in organic revenue improved margin 24% margin 2005 ... -
Page 21
Business review and outlook -
Page 22
What is helping us grow? Simplicity Integrity Agility Innovation Trust 22 -
Page 23
... 4 millions Basis of our strong market position - Dynamic source of migrations and upgrades - Recurring revenues through service support contracts 3 2 2004 2005 2006 Customer base New customers - organic New customers - acquired Employees Sage customers % of Sage customers 0-25 4.4m 84% >25... -
Page 24
Global CRM • • Organic growth +8% - reorganised on a global basis end 2005 Comprehensive range of products - ACT! - entry level - Sage CRM and SageCRM.com hosted version - mid-market - SalesLogix - industry-specific application 19% 5% 5% 71% North America UK Mainland Europe Rest of ... -
Page 25
Technology initiatives We remain committed to developing local products for local markets Standardise on technologies where appropriate Offer choice where appropriate MySQL partnership announced October 2006 25 -
Page 26
... strategy Based on our core competency: knowledge and experience of the SME market Three principles to acquisition strategy: - Broaden our product lines - Enter new geographic regions - Add new industry-specific applications to our product lines • More than accounting software provider... -
Page 27
Changing revenue mix of our products 2005 8% 7% 2006 3% 16% 14% 15% 61% 60% 16% Accounting Payroll/HR Other Industry-specific CRM 27 -
Page 28
Industry-specific market presence Health care Food distribution Transport Manufacturing Real estate/construction Accountancy practices Not-for-profit Retail 28 -
Page 29
... - 96% of practices in this market segment 90% of customers on combined software/support contracts Parallels with Sage's practice management solutions for accountancy practices Application of Sage's expertise in rationalising cost base - Opportunity to cross-sell back-office products in future 29 -
Page 30
... - Electronic Health Records Support - adoption and renewal rates > 90% Network services: information and transaction tools - eligibility assessment, insurance claim tracking, patient bill statements - used by 64% of EPS customers Network Services 37% Software 18% Other 10% Support 35... -
Page 31
... to needs of SMEs - Cost effective - Easy implementation - Designed to help SMEs manage their businesses better • Front office application with tie-in to both front and back office functions - CRM, POS, other payment services - Stock control, invoicing, accounting • Both growing strongly... -
Page 32
Objectives and outlook Build on current strong position in the SME market to sustain organic growth Maintain strong competitive positions in all markets Improve margins and growth at Sage Healthcare Division Integration of other 2006 acquisitions Expand merchant services business Initial ... -
Page 33
Supplementary information -
Page 34
...rates TOTAL EXCLUDING FOREX less 2006 acquisitions (Adonix, Verus, UBS, Master Builder, Elit, Bäurer, Emdeon) less 2006 disposal (CPASoftware) less 2005 acquisitions (FLS, C2G, Simultan, Symfonia, Logic Control, Cogestib) less contribution of non-core products 2006 £m 935.6 935.6 (87.7) % growth... -
Page 35
Operating profit by region £m 2006 EBITA pre share-based payment Share-based payment UK 78.4 (2.8) Mainland Europe 68.5 (2.0) North America 92.5 (3.6) Rest of World 18.8 (0.5) TOTAL 258.2 (8.9) Earnings before interest, tax and net amortisation (EBITA) Amortisation of ... -
Page 36
... mix by region UK* 31% 12% North America 16% 17% 36% 21% 14% 53% GROUP Small business * Premium versions of small business accounts products reclassed as midmarket Mid-market Software 17% 18% 35% Services 19% 36% 46% 64% 65% Rest of World 15% 23% Mainland Europe 6% 23% 15% 56... -
Page 37
Support contracts thousands 1,600 1,400 1,200 1,000 800 600 400 200 0 Sept 02 UK Sept 03 Mainland Europe Sept 04 Sept 05 Sept 06 North America Rest of World 37 -
Page 38
UK Revenues Software Services Total £87.1m £118.1m £205.2m Total customers 701,000 Customers* New customers 44,000 Profit EBITA EBITA margin £75.6m 37% Support contracts New support contracts Total support contracts 30,000 351,000 * Excluding ACT! 38 -
Page 39
Mainland Europe Revenues Software Services Total £87.9m £211.9m £299.8m Total customers 1,415,000 Customers* New customers 112,000 Profit EBITA EBITA margin £66.5m 22% Support contracts New support contracts Total support contracts 55,000 516,000 * Excluding ACT! 39 -
Page 40
North America Revenues Software Services Total £121.6m £239.9m £361.5m Total customers 2,724,000 Customers* New customers 252,000 Profit EBITA EBITA margin £86.2m** 24%** Support contracts New support contracts Total support contracts 128,000 600,000 * Excluding ACT! ** Excluding gain on sale... -
Page 41
Rest of World Revenues Software Services Total £26.2m £42.9m £69.1m Total customers 397,000 Customers* New customers 145,000 Profit EBITA EBITA margin £18.3m 26% Support contracts New support contracts Total support contracts 15,000 92,000 * Excluding ACT! 41