Paychex 2014 Annual Report Download - page 3
Download and view the complete annual report
Please find page 3 of the 2014 Paychex annual report below. You can navigate through the pages in the report by either clicking on the pages listed below, or by using the keyword search tool below to find specific information within the annual report.-
 1
1 -
 2
2 -
 3
3 -
 4
4 -
 5
5 -
 6
6 -
 7
7 -
 8
8 -
 9
9 -
 10
10 -
 11
11 -
 12
12 -
 13
13 -
 14
14 -
15
-
16
-
17
-
18
-
19
-
20
-
21
-
22
-
23
-
24
-
25
-
26
-
27
-
28
-
29
-
30
-
31
-
32
-
33
-
34
-
35
-
36
-
37
-
38
-
39
-
40
-
41
-
42
-
43
-
44
-
45
-
46
-
47
-
48
-
49
-
50
-
51
-
52
-
53
-
54
-
55
-
56
-
57
-
58
-
59
-
60
-
61
-
62
-
63
-
64
-
65
-
66
-
67
-
68
-
69
-
70
-
71
-
72
-
73
-
74
-
75
-
76
-
77
-
78
-
79
-
80
-
81
-
82
-
83
-
84
-
85
-
86
-
87
-
88
-
89
-
90
-
91
-
92
-
93
-
94
-
95
-
96
-
97
 |
 |

2010 2011 2012 2013 2014
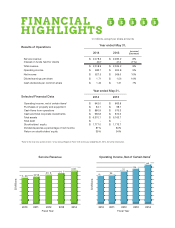
Results of Operations
Selected Financial Data
1Refer to the Overview section of Item 7 of our Annual Report on Form 10-K for the year ended May 31, 2014, for further information.
In millions, except per share amounts
Year ended May 31,
2014 2013 Increase/
(Decrease)
Service revenue $ 2,478.2 $ 2,285.2 8%
Interest on funds held for clients 40.7 41.0 (1%)
Total revenue $ 2,518.9 $ 2,326.2 8%
Operating income $ 982.7 $ 904.8 9%
Net income $ 627.5 $ 569.0 10%
Diluted earnings per share $ 1.71 $ 1.56 10%
Cash dividends per common share $ 1.40 $ 1.31 7%
Year ended May 31,
2014 2013
Operating income, net of certain items1 $ 942.0 $ 863.8
Purchases of property and equipment $ 84.1 $ 98.7
Cash fl ows from operations $ 880.9 $ 675.3
Cash and total corporate investments $ 936.8 $ 874.6
Total assets $ 6,370.1 $ 6,163.7
Total debt $ - $ -
Stockholders’ equity $ 1,777.0 $ 1,773.7
Dividends paid as a percentage of net income 81% 84%
Return on stockholders’ equity 35% 34%
FINANCIAL
HIGHLIGHTS
2010 2011 2012 2013 2014
$ Millions
Fiscal Year
8:; 95:
:32
:86
;64
$ Millions
Fiscal Year
3. ; 6 8 4.258 4.3: 8 4.4: 7
4.69:
Service Revenue
Operating Income, Net of Certain Items
1