Panera Bread 2005 Annual Report Download - page 61
Download and view the complete annual report
Please find page 61 of the 2005 Panera Bread annual report below. You can navigate through the pages in the report by either clicking on the pages listed below, or by using the keyword search tool below to find specific information within the annual report.-
 1
1 -
2
-
3
-
4
-
5
-
6
-
7
-
8
-
9
-
10
-
11
-
12
-
13
-
14
-
15
-
16
-
17
-
18
-
19
-
20
-
21
-
22
-
23
-
24
-
25
-
26
-
27
-
28
-
29
-
30
-
31
-
32
-
33
-
34
-
35
-
36
-
37
-
38
-
39
-
40
-
41
-
42
-
43
-
44
-
45
-
46
-
47
-
48
-
49
-
50
-
 51
51 -
 52
52 -
 53
53 -
 54
54 -
 55
55 -
 56
56 -
 57
57 -
 58
58 -
 59
59 -
 60
60 -
 61
61 -
 62
62 -
 63
63 -
 64
64 -
 65
65 -
 66
66 -
 67
67 -
 68
68 -
 69
69 -
 70
70 -
 71
71 -
72
 |
 |

55
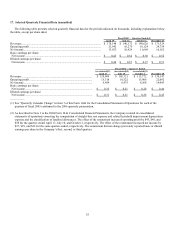
17. Selected Quarterly Financial Data (unaudited)
The following table presents selected quarterly financial data for the periods indicated (in thousands, including explanations below
the table, except per share data):
Fiscal 2005 — Quarters Ended(1)
April 19 July 12 October 4 December 27
Revenues.............................................................................................................. $ 178,148 $ 140,172 $ 148,626 $ 173,329
Operating profit ................................................................................................... 21,942 16,275 18,124 24,754
Net income........................................................................................................... 13,923 10,429 11,669 16,162
Basic earnings per share:
Net income ......................................................................................................... $ 0.45 $ 0.34 $ 0.38 $ 0.52
Diluted earnings per share:
Net income ......................................................................................................... $ 0.44 $ 0.33 $ 0.37 $ 0.51
Fiscal 2004 — Quarters Ended
(as restated)(2)
April 17
(as restated)(2)
July 10
(as restated)(2)
October 2
December 25
Revenues.................................................................................................. $ 129,899 $ 105,321 $ 113,772 $ 130,147
Operating profit ....................................................................................... 15,318 10,522 13,906 22,092
Net income............................................................................................... 9,494 6,475 8,568 14,043
Basic earnings per share:
Net income ............................................................................................. $ 0.32 $ 0.21 $ 0.28 $ 0.46
Diluted earnings per share:
Net income ............................................................................................. $ 0.31 $ 0.21 $ 0.28 $ 0.45
__________
(1) See “Quarterly Calendar Change” in Item 7 of this Form 10-K for the Consolidated Statement of Operations for each of the
quarters of fiscal 2005 conformed to the 2006 quarterly presentation.
(2) As described in Note 3 to the 2004 Form 10-K Consolidated Financial Statements, the Company restated its consolidated
statements of operations correcting the computation of straight-line rent expense and related leasehold improvement depreciation
expense and the classification of landlord allowances. The effect of the restatement increased operating profit by $43, $46, and
$50 for the quarters ended April 17, July 10, and October 2, respectively. The effect of the restatement increased net income by
$27, $29, and $32 for the same quarters ended, respectively. The restatement did not change previously reported basic or diluted
earnings per share in the Company’s first, second, or third quarters.