PSE&G 2009 Annual Report Download - page 2
Download and view the complete annual report
Please find page 2 of the 2009 PSE&G annual report below. You can navigate through the pages in the report by either clicking on the pages listed below, or by using the keyword search tool below to find specific information within the annual report.-
 1
1 -
 2
2 -
 3
3 -
 4
4 -
 5
5 -
 6
6 -
 7
7 -
 8
8
 |
 |

PSEG Overview
Public Service Enterprise Group (PSEG), a diversifi ed
energy holding company with over $28 billion in
assets, is one of the nation’s leading wholesale
energy producers and most reliable electric and gas
transmission and delivery utilities.
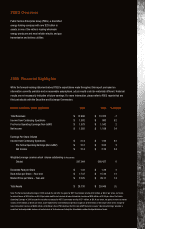
2009 Financial Highlights
While the forward-looking statements about PSEG’s expectations made throughout this report are based on
information currently available and on reasonable assumptions, actual results could be materially different. Historical
results are not necessarily indicative of future earnings. For more information, please refer to PSEG reports that are
fi led periodically with the Securities and Exchange Commission.
Dollars in millions, where applicable 2009 2008 % change
Total Revenues $ 12,406 $ 13,322 -7
Income from Continuing Operations $ 1,592 $ 983 62
Pro Forma Operating Earnings (Non-GAAP) $ 1,579 $ 1,542 2
Net Income $ 1,592 $ 1,188 34
Earnings Per Share-Diluted
Income from Continuing Operations $ 3.14 $ 1.93 63
Pro Forma Operating Earnings (Non-GAAP) $ 3.12 $ 3.03 3
Net Income $ 3.14 $ 2.34 34
Weighted average common stock shares outstanding (in thousands)
Diluted 507,064 508,427 0
Dividends Paid per Share $ 1.33 $ 1.29 3
Book Value per Share – Year-end $ 17.37 $ 15.36 13
Market Price per Share – Year-end $ 33.25 $ 29.17 14
Total Assets $ 28,730 $ 29,049 (1)
Note: Pro Forma Operating Earnings in 2009 exclude the net after-tax gains for NDT Fund related activity of $9 million, or $0.02 per share, net mark-
to-market losses of $25 million, or $0.05 per share and the net reversal of lease transaction reserves of $29 million, or $0.05 per share. Pro Forma
Operating Earnings in 2008 exclude the net after-tax losses for NDT Fund related activity of $71 million, or $0.14 per share, net gains on mark-to market
activity of $16 million, or $0.03 per share, asset Impairments and related bond premium expenses of $14 million, or $0.03 per share and a charge for
lease transaction reserves of $490 million, or $0.96 per share. PSEG believes that the non-GAAP fi nancial measure “Operating Earnings” provides a
consistent and comparable measure of performance of its businesses to help the shareholders understand performance trends.