PNC Bank 2011 Annual Report Download - page 218
Download and view the complete annual report
Please find page 218 of the 2011 PNC Bank annual report below. You can navigate through the pages in the report by either clicking on the pages listed below, or by using the keyword search tool below to find specific information within the annual report.-
 1
1 -
2
-
3
-
4
-
5
-
6
-
7
-
8
-
9
-
10
-
11
-
12
-
13
-
14
-
15
-
16
-
17
-
18
-
19
-
20
-
21
-
22
-
23
-
24
-
25
-
26
-
27
-
28
-
29
-
30
-
31
-
32
-
33
-
34
-
35
-
36
-
37
-
38
-
39
-
40
-
41
-
42
-
43
-
44
-
45
-
46
-
47
-
48
-
49
-
50
-
51
-
52
-
53
-
54
-
55
-
56
-
57
-
58
-
59
-
60
-
61
-
62
-
63
-
64
-
65
-
66
-
67
-
68
-
69
-
70
-
71
-
72
-
73
-
74
-
75
-
76
-
77
-
78
-
79
-
80
-
81
-
82
-
83
-
84
-
85
-
86
-
87
-
88
-
89
-
90
-
91
-
92
-
93
-
94
-
95
-
96
-
97
-
98
-
99
-
100
-
101
-
102
-
103
-
104
-
105
-
106
-
107
-
108
-
109
-
110
-
111
-
112
-
113
-
114
-
115
-
116
-
117
-
118
-
119
-
120
-
121
-
122
-
123
-
124
-
125
-
126
-
127
-
128
-
129
-
130
-
131
-
132
-
133
-
134
-
135
-
136
-
137
-
138
-
139
-
140
-
141
-
142
-
143
-
144
-
145
-
146
-
147
-
148
-
149
-
150
-
151
-
152
-
153
-
154
-
155
-
156
-
157
-
158
-
159
-
160
-
161
-
162
-
163
-
164
-
165
-
166
-
167
-
168
-
169
-
170
-
171
-
172
-
173
-
174
-
175
-
176
-
177
-
178
-
179
-
180
-
181
-
182
-
183
-
184
-
185
-
186
-
187
-
188
-
189
-
190
-
191
-
192
-
193
-
194
-
195
-
196
-
197
-
198
-
199
-
200
-
201
-
202
-
203
-
204
-
205
-
206
-
207
-
 208
208 -
 209
209 -
 210
210 -
 211
211 -
 212
212 -
 213
213 -
 214
214 -
 215
215 -
 216
216 -
 217
217 -
 218
218 -
 219
219 -
 220
220 -
 221
221 -
 222
222 -
 223
223 -
 224
224 -
 225
225 -
 226
226 -
 227
227 -
 228
228 -
229
-
230
-
231
-
232
-
233
-
234
-
235
-
236
-
237
-
238
 |
 |

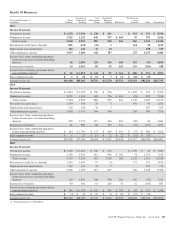
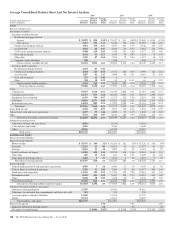
Nonaccrual loans are included in loans, net of unearned income. The impact of financial derivatives used in interest rate risk management is included in the interest
income/expense and average yields/rates of the related assets and liabilities. Basis adjustments related to hedged items are included in noninterest-earning assets and
noninterest-bearing liabilities. Average balances of securities are based on amortized historical cost (excluding adjustments to fair value, which are included in other
assets). Average balances for certain loans and borrowed funds accounted for at fair value, with changes in fair value recorded in trading noninterest income, are
included in noninterest-earning assets and noninterest-bearing liabilities. The interest-earning deposits with the Federal Reserve are included in the “Other” interest-
earning assets category.
Loan fees for the years ended December 31, 2011, 2010, and 2009 were $175 million, $154 million, and $162 million, respectively.
Interest income includes the effects of taxable-equivalent adjustments using a marginal federal income tax rate of 35% to increase tax-exempt interest income to a
taxable-equivalent basis. The taxable-equivalent adjustments to interest income for the years ended December 31, 2011, 2010, and 2009 were $104 million, $81
million, and $65 million, respectively.
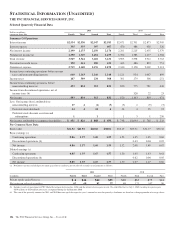
L
OANS
O
UTSTANDING
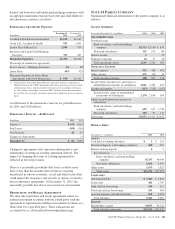
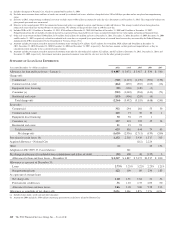
December 31 – in millions 2011 (a) 2010 (a) 2009 (a) 2008 (a) 2007
Commercial lending
Commercial $ 65,694 $ 55,177 $ 54,818 $ 69,220 $28,952
Commercial real estate 16,204 17,934 23,131 25,736 8,903
Equipment lease financing 6,416 6,393 6,202 6,461 2,514
TOTAL COMMERCIAL LENDING 88,314 79,504 84,151 101,417 40,369
Consumer lending
Home equity 33,089 34,226 35,947 38,276 14,447
Residential real estate 14,469 15,999 19,810 21,583 9,557
Credit card 3,976 3,920 2,569 2,237 247
Other consumer 19,166 16,946 15,066 11,976 3,699
TOTAL CONSUMER LENDING 70,700 71,091 73,392 74,072 27,950
Total loans $159,014 $150,595 $157,543 $175,489 $68,319
(a) Includes the impact of National City, which we acquired on December 31, 2008.
N
ONPERFORMING
A
SSETS AND
R
ELATED
I
NFORMATION
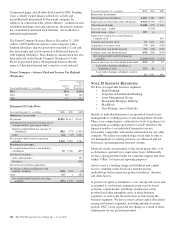
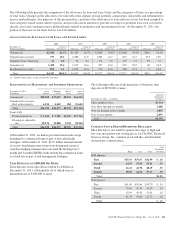
December 31 - dollars in millions 2011 (a) 2010 (a) 2009 (a) 2008 (a) 2007
Nonperforming loans
Commercial $ 899 $1,253 $1,806 $ 576 $193
Commercial real estate 1,345 1,835 2,140 766 214
Equipment lease financing 22 77 130 97 3
TOTAL COMMERCIAL LENDING 2,266 3,165 4,076 1,439 410
Consumer (b)
Home equity 529 448 356 66 16
Residential real estate (c) 726 818 1,203 153 27
Credit card (d) 8
Other consumer 31 35 36 4 1
TOTAL CONSUMER LENDING 1,294 1,301 1,595 223 44
Total nonperforming loans (e) 3,560 4,466 5,671 1,662 454
OREO and foreclosed assets
Other real estate owned (OREO) (f) 561 589 484 422 41
Foreclosed and other assets 35 68 49 16
TOTAL OREO AND FORECLOSED ASSETS 596 657 533 438 41
Total nonperforming assets $4,156 $5,123 $6,204 $2,100 $495
Nonperforming loans to total loans 2.24% 2.97% 3.60% .95% .66%
Nonperforming assets to total loans, OREO and foreclosed assets 2.60 3.39 3.92 1.19 .72
Nonperforming assets to total assets 1.53 1.94 2.30 .72 .36
Interest on nonperforming loans
Computed on original terms $ 278 $ 329 $ 302 $ 115 $ 51
Recognized prior to nonperforming status 47 53 90 60 32
Past due loans
Accruing loans past due 90 days or more (g) $2,973 $2,709 $2,698 $1,321 $136
As a percentage of total loans 1.87% 1.80% 1.71% .75% .20%
Past due loans held for sale
Accruing loans held for sale past due 90 days or more (h) $49 $65 $72 $40 $8
As a percentage of total loans held for sale 1.67% 1.86% 2.84% .92% .20%
The PNC Financial Services Group, Inc. – Form 10-K 209