PNC Bank 2000 Annual Report Download - page 47
Download and view the complete annual report
Please find page 47 of the 2000 PNC Bank annual report below. You can navigate through the pages in the report by either clicking on the pages listed below, or by using the keyword search tool below to find specific information within the annual report.-
 1
1 -
2
-
3
-
4
-
5
-
6
-
7
-
8
-
9
-
10
-
11
-
12
-
13
-
14
-
15
-
16
-
17
-
18
-
19
-
20
-
21
-
22
-
23
-
24
-
25
-
26
-
27
-
28
-
29
-
30
-
31
-
32
-
33
-
34
-
35
-
36
-
 37
37 -
 38
38 -
 39
39 -
 40
40 -
 41
41 -
 42
42 -
 43
43 -
 44
44 -
 45
45 -
 46
46 -
 47
47 -
 48
48 -
 49
49 -
 50
50 -
 51
51 -
 52
52 -
 53
53 -
 54
54 -
 55
55 -
 56
56 -
 57
57 -
58
-
59
-
60
-
61
-
62
-
63
-
64
-
65
-
66
-
67
-
68
-
69
-
70
-
71
-
72
-
73
-
74
-
75
-
76
-
77
-
78
-
79
-
80
-
81
-
82
-
83
-
84
-
85
-
86
-
87
-
88
-
89
-
90
-
91
-
92
-
93
-
94
-
95
-
96
 |
 |

44
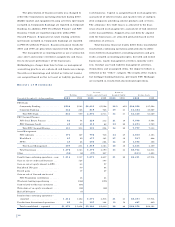
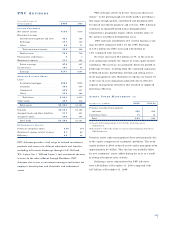
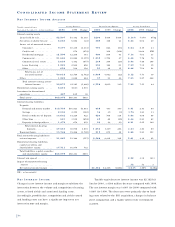
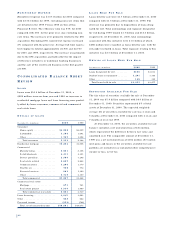
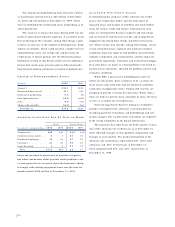
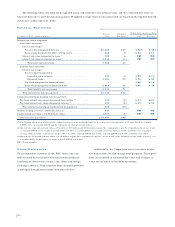
CO N S O L I D AT E D IN C O M E ST A T E M E N T RE V I E W
NE T IN T E R E S T IN C O M E AN A LY S I S
Taxable-equivalent basis Average Balances Interest Income/Expense Average Yields/Rates
Year ended December 31 – dollars in millions 2000 1999 Change 2000 1999 Change 2000 1999 Change
Interest-earning assets
Loans held for sale. . . . . . . . . . . $2,507 $1,392 $1,115 $204 $104 $100 8.14% 7.47% 67bp
Securities available for sale . . . . 6,061 6,084 (23) 389 366 23 6.42 6.02 40
Loans, net of unearned income
Consumer . . . . . . . . . . . . . . . 9,177 10,310 (1,133) 791 844 (53) 8.62 8.19 43
Credit card. . . . . . . . . . . . . . . 672 (672) 100 (100) 14.88 NM
Residential mortgage . . . . . . . 12,599 12,258 341 900 859 41 7.14 7.01 13
Commercial . . . . . . . . . . . . . . 21,685 23,082 (1,397) 1,839 1,792 47 8.48 7.76 72
Commercial real estate. . . . . . 2,685 3,362 (677) 240 265 (25) 8.94 7.88 106
Lease financing . . . . . . . . . . . 3,222 2,564 658 235 182 53 7.29 7.10 19
Other. . . . . . . . . . . . . . . . . . . 650 532 118 55 40 15 8.46 7.52 94
Total loans, net of
unearned income . . . . . . . . 50,018 52,780 (2,762) 4,060 4,082 (22) 8.12 7.73 39
Other . . . . . . . . . . . . . . . . . . . 1,289 1,045 244 97 53 44 7.53 5.07 246
Total interest-earning assets/
interest income. . . . . . . . . . 59,875 61,301 (1,426) 4,750 4,605 145 7.93 7.51 42
Noninterest-earning assets . . . . . . . 8,616 6,613 2,003
Investment in discontinued
operations . . . . . . . . . . . . . . . . . 487 449 38
Total assets . . . . . . . . . . . . . . . . $68,978 $68,363 $615
Interest-bearing liabilities
Deposits
Demand and money market . . $18,735 $16,921 $1,814 658 493 165 3.51 2.91 60
Savings . . . . . . . . . . . . . . . . . 2,050 2,390 (340) 36 39 (3) 1.76 1.63 13
Retail certificates of deposit. . 14,642 14,220 422 826 708 118 5.64 4.98 66
Other time . . . . . . . . . . . . . . . 621 1,515 (894) 40 85 (45) 6.44 5.61 83
Deposits in foreign offices. . . . 1,473 872 601 93 44 49 6.31 5.05 126
Total interest-bearing
deposits . . . . . . . . . . . . . 37,521 35,918 1,603 1,653 1,369 284 4.41 3.81 60
Borrowed funds . . . . . . . . . . . . . 13,746 15,466 (1,720) 915 870 45 6.66 5.63 103
Total interest-bearing liabilities/
interest expense. . . . . . . . . . . . . 51,267 51,384 (117) 2,568 2,239 329 5.01 4.36 65
Noninterest-bearing liabilities,
capital securities and
shareholders’ equity. . . . . . . . . . 17,711 16,979 732
Total liabilities, capital securities
and shareholders’ equity. . . . . $68,978 $68,363 $615
Interest rate spread . . . . . . . . . . . . 2.92 3.15 (23)
Impact of noninterest-bearing
sources . . . . . . . . . . . . . . . . . .72 .71 1
Net interest income/margin . . . . $2,182 $2,366 $(184) 3.64%3.86% (22)bp
NM – not meaningful
NE T IN T E R E S T IN C O M E
Changes in net interest income and margin result from the
interaction between the volume and composition of earning
assets, related yields and associated funding costs.
Accordingly, portfolio size, composition and yields earned
and funding costs can have a significant impact on net
interest income and margin.
Taxable-equivalent net interest income was $2.182 bil-
lion for 2000, a $184 million decrease compared with 1999.
The net interest margin was 3.64% for 2000 compared with
3.86% for 1999. The decreases were primarily due to fund-
ing costs related to the ISG acquisition, changes in balance
sheet composition and a higher interest rate environment
in 2000.