Oki 2002 Annual Report Download - page 19
Download and view the complete annual report
Please find page 19 of the 2002 Oki annual report below. You can navigate through the pages in the report by either clicking on the pages listed below, or by using the keyword search tool below to find specific information within the annual report.-
 1
1 -
2
-
3
-
4
-
5
-
6
-
7
-
8
-
 9
9 -
 10
10 -
 11
11 -
 12
12 -
 13
13 -
 14
14 -
 15
15 -
 16
16 -
 17
17 -
 18
18 -
 19
19 -
 20
20 -
 21
21 -
 22
22 -
 23
23 -
 24
24 -
 25
25 -
 26
26 -
 27
27 -
 28
28 -
 29
29 -
30
-
31
-
32
-
33
-
34
-
35
-
36
-
37
-
38
 |
 |

Oki Electric Industry Co., Ltd. Annual Report 2002 17
Operating Results by Segment
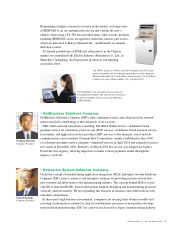
Information Systems
Sales to third parties dropped 4.2%, to ¥337,752 million. Owing to
increased profitability of printers, however, primarily attributable to
the effects of a weaker yen, operating income climbed 96.6%, to
¥2,919 million. The steady growth in printer sales overrode cuts in
corporate IT capital investment and heightened competition in the
market for government ministries and agencies.
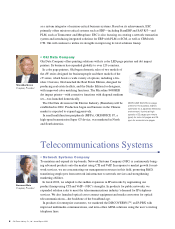
Telecommunications Systems
Sales to third parties fell 27.8%, to ¥117,972 million. Operating loss
totaled ¥9,366 million, compared with operating income of ¥7,200
million in fiscal 2001. This was due to a drop in demand in Japan for
integrated services digital network (ISDN) switches brought about
by the introduction of ADSL, and to reduced investment and demand
in the U.S. telecommunications market.
Electronic Devices
The semiconductor market experienced unusually low demand and
price drops, and the sale of optical components for telecommunica-
tions systems suffered, owing to low investment and demand in the
U.S. telecommunications market. This led to a 37.6% decrease in sales
to third parties, to ¥113,642 million, and an operating loss of ¥11,858
million, from ¥29,886 million in operating income in fiscal 2001.
Financial Position
Assets, Liabilities and Shareholders’ Equity
Total assets dropped ¥80,901 million, or 11.0%, to ¥651,581 million.
Total shareholders’ equity per share fell from ¥243.12 to ¥178.16.
Total current assets fell 14.7%, or ¥63,857 million, to ¥369,383
million. This was primarily due to lower cash and cash equivalents,
time deposits and notes and accounts receivable.
Property, plant and equipment, net, dipped 7.3%, or ¥12,887
million, to ¥163,844 million.
Total liabilities fell 7.1%, or ¥41,055 million, to ¥537,200 million.
This was primarily due to a drop in notes and accounts payable. As
a result, interest-bearing debt dipped 0.2%, or ¥871 million, to
¥355,802 million, and the debt-to-equity ratio rose from 2.4 to 3.3
times. Total shareholders’ equity fell ¥39,778 million, or 26.7%,
to ¥109,066 million. This was primarily caused by the Company
recording an accumulated deficit of ¥35,545 million, in turn brought
about by a net loss totaling ¥34,077 million. The shareholders’
equity ratio dropped from 20.3% to 16.7%.
Net Income (Loss) per Share
(Yen)
Total Assets, Total Shareholders’ Equity and
Shareholders’ Equity Ratio
(Millions of yen) (%)
Interest-Bearing Debt
(Millions of yen)
1.87
14.61
–55.66
748,432 732,483
651,581
142,563 148,844 109,066
19.0% 20.3%
16.7%
418,370
356,673 355,802
Total Assets
Total Shareholders’ Equity
Shareholders’ Equity Ratio
–60
–45
–30
–15
0
15
0
180,000
360,000
540,000
720,000
900,000
0
6
12
18
24
30
0
100,000
200,000
300,000
400,000
500,000
2001 20022000 2001 20022000 2001 20022000