OfficeMax 2015 Annual Report Download - page 115
Download and view the complete annual report
Please find page 115 of the 2015 OfficeMax annual report below. You can navigate through the pages in the report by either clicking on the pages listed below, or by using the keyword search tool below to find specific information within the annual report.-
 1
1 -
2
-
3
-
4
-
5
-
6
-
7
-
8
-
9
-
10
-
11
-
12
-
13
-
14
-
15
-
16
-
17
-
18
-
19
-
20
-
21
-
22
-
23
-
24
-
25
-
26
-
27
-
28
-
29
-
30
-
31
-
32
-
33
-
34
-
35
-
36
-
37
-
38
-
39
-
40
-
41
-
42
-
43
-
44
-
45
-
46
-
47
-
48
-
49
-
50
-
51
-
52
-
53
-
54
-
55
-
56
-
57
-
58
-
59
-
60
-
61
-
62
-
63
-
64
-
65
-
66
-
67
-
68
-
69
-
70
-
71
-
72
-
73
-
74
-
75
-
76
-
77
-
78
-
79
-
80
-
81
-
82
-
83
-
84
-
85
-
86
-
87
-
88
-
89
-
90
-
91
-
92
-
93
-
94
-
95
-
96
-
97
-
98
-
99
-
100
-
101
-
102
-
103
-
104
-
 105
105 -
 106
106 -
 107
107 -
 108
108 -
 109
109 -
 110
110 -
 111
111 -
 112
112 -
 113
113 -
 114
114 -
 115
115 -
 116
116 -
 117
117 -
 118
118 -
 119
119 -
 120
120 -
 121
121 -
 122
122 -
 123
123 -
 124
124 -
 125
125 -
126
-
127
-
128
-
129
-
130
-
131
-
132
-
133
-
134
-
135
-
136
 |
 |

Table of Contents
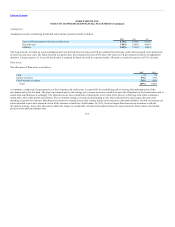
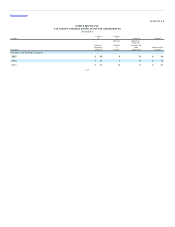
As of December 26, 2015, the Company sold to customers throughout North America, Europe, and Asia/Pacific. The Company operates through wholly-
owned entities and participates in other ventures and alliances. There is no single country outside of the United States or single customer that accounts for
10% or more of the Company’s total sales. Geographic financial information relating to the Company’s business is as follows:
Sales Property and Equipment, Net
(In millions) 2014 2013 2014 2013
United States $ 12,132 $ 8,119 $ 757 $ 977
International 3,964 3,123 206 332
Total $ 16,096 $ 11,242 $ 963 $ 1,309
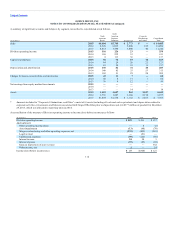
The Company classifies products into three categories: (1) supplies, (2) technology, and (3) furniture and other. The supplies category includes products such
as paper, binders, writing instruments, cleaning and breakroom items and school supplies. The technology category includes products such as desktop and
laptop computers, monitors, tablets, printers, ink and toner, cables, software, digital cameras, telephones, and wireless communications products. The
furniture and other category includes products such as desks, chairs, luggage, sales in the copy and print centers, and other miscellaneous items.
Total Company sales by product category were as follows:
2014 2013
Supplies 47.2% 46.6%
Technology 38.0% 40.6%
Furniture and other 14.8% 12.8%
100.0% 100.0%
113