OfficeMax 2014 Annual Report Download - page 107
Download and view the complete annual report
Please find page 107 of the 2014 OfficeMax annual report below. You can navigate through the pages in the report by either clicking on the pages listed below, or by using the keyword search tool below to find specific information within the annual report.-
 1
1 -
2
-
3
-
4
-
5
-
6
-
7
-
8
-
9
-
10
-
11
-
12
-
13
-
14
-
15
-
16
-
17
-
18
-
19
-
20
-
21
-
22
-
23
-
24
-
25
-
26
-
27
-
28
-
29
-
30
-
31
-
32
-
33
-
34
-
35
-
36
-
37
-
38
-
39
-
40
-
41
-
42
-
43
-
44
-
45
-
46
-
47
-
48
-
49
-
50
-
51
-
52
-
53
-
54
-
55
-
56
-
57
-
58
-
59
-
60
-
61
-
62
-
63
-
64
-
65
-
66
-
67
-
68
-
69
-
70
-
71
-
72
-
73
-
74
-
75
-
76
-
77
-
78
-
79
-
80
-
81
-
82
-
83
-
84
-
85
-
86
-
87
-
88
-
89
-
90
-
91
-
92
-
93
-
94
-
95
-
96
-
 97
97 -
 98
98 -
 99
99 -
 100
100 -
 101
101 -
 102
102 -
 103
103 -
 104
104 -
 105
105 -
 106
106 -
 107
107 -
 108
108 -
 109
109 -
 110
110 -
 111
111 -
 112
112 -
 113
113 -
 114
114 -
 115
115 -
 116
116 -
 117
117 -
118
-
119
-
120
-
121
-
122
-
123
-
124
-
125
-
126
-
127
-
128
-
129
-
130
-
131
-
132
-
133
-
134
-
135
-
136
-
137
-
138
-
139
-
140
-
141
-
142
-
143
-
144
-
145
-
146
-
147
-
148
-
149
-
150
-
151
-
152
-
153
-
154
-
155
-
156
-
157
-
158
-
159
-
160
-
161
-
162
-
163
-
164
-
165
-
166
-
167
-
168
-
169
-
170
-
171
-
172
-
173
-
174
-
175
-
176
-
177
 |
 |

Table of Contents
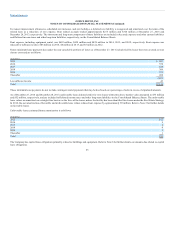
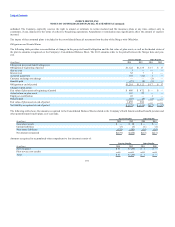
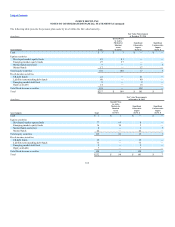
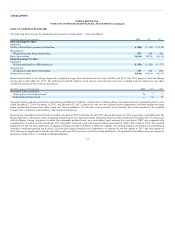
The following table presents the pension plan assets by level within the fair value hierarchy at year-ends.
(In millions)
Money market funds $ 18 $ — $ 18 $ —
Equity securities
U.S. large-cap 24 24 — —
U.S. small and mid-cap 4 4 — —
International 58 58 — —
Total equity securities 86 86 — —
Fixed-income securities
Corporate bonds 612 — 612 —
Government securities 19 — 19 —
Other fixed-income 39 — 39 —
Total fixed-income securities 670 — 670 —
Other
Equity mutual funds 255 — 255 —
Other, including plan receivables and payables 10 10 — —
$1,039 $ 96 $ 943 $ —
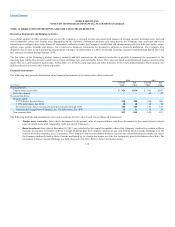
(In millions)
Money market funds $ 25 $ 25 $ — $ —
Equity securities
U.S. large-cap 18 18 — —
U.S. small and mid-cap 4 4 — —
International 56 56 — —
Total equity securities 78 78 — —
Fixed-income securities
Corporate bonds 459 — 459 —
Government securities 18 — 18 —
Other fixed-income 41 — 41 —
Total fixed-income securities 518 — 518 —
Other
Equity mutual funds 353 — 353 —
Other, including plan receivables and payables 12 12 — —
$986 $ 115 $ 871 $ —
105