O'Reilly Auto Parts 2007 Annual Report Download - page 2
Download and view the complete annual report
Please find page 2 of the 2007 O'Reilly Auto Parts annual report below. You can navigate through the pages in the report by either clicking on the pages listed below, or by using the keyword search tool below to find specific information within the annual report.-
 1
1 -
 2
2 -
 3
3 -
 4
4 -
 5
5 -
 6
6 -
 7
7 -
 8
8 -
 9
9 -
 10
10 -
 11
11 -
 12
12 -
 13
13 -
14
-
15
-
16
-
17
-
18
-
19
-
20
-
21
-
22
-
23
-
24
-
25
-
26
-
27
-
28
-
29
-
30
-
31
-
32
-
33
-
34
-
35
-
36
-
37
-
38
-
39
-
40
-
41
-
42
-
43
-
44
-
45
-
46
-
47
-
48
-
49
-
50
-
51
-
52
 |
 |

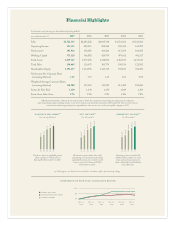
Financial Highlights
In thousands, except earnings per share data and operating data (a)
years ended december 31 2007 2006 2005 2004 2003
Sales $2,522,319 $2,283,222 $2,045,318 $1,721,241 $1,511,816
Operating Income 305,151 282,315 252,524 190,458 165,275
Net Income(a) 193,988 178,085 164,266 117,674 100,087
Working Capital 573,328 566,892 424,974 479,662 441,617
Total Assets 2,279,737 1,977,496 1,718,896 1,432,357 1,157,033
Total Debt 100,469 110,479 100,774 100,914 121,902
Shareholders’ Equity 1,592,477 1,364,096 1,145,769 947,817 784,285
Net Income Per Common Share
(assuming dilution) 1.67 1.55 1.45 1.05 0.92
Weighted-Average Common Shares
(assuming dilution) 116,080 115,119 113,385 111,423 109,060
Stores At Year-End 1,830 1,640 1,470 1,249 1,109
Same-Store Sales Gain 3.7% 3.3% 7.5% 6.8% 7.8%
Our focus remains on profitable growth
which resulted in a 7.7% increase in
Earning Per Share to $1.67 in 2007.
EARNINGS PER SHARE(a)
(assuming dilution)
Operating income increased 8.1%
to $305 million in 2007 as a result
of our continued improvements in
vendor relationships and distribution
system efficiencies.
OPERATING INCOME(a)
(in thousands)
We continue to grow market share while
maintaining our commitment to providing
unparalleled customer service which resulted
in an increase in Net Income of 8.9% to
$194 million in 2007.
NET INCOME(a)
(in thousands)
(a) 2004 figures are based on income before cumulative effect of accounting change.
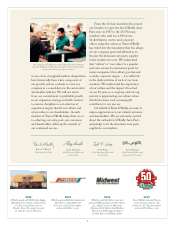
O’Reilly generated another solid year of sales and earnings in 2007. Our commitment to providing the right part at the right price
while maintaining industry-leading customer service levels continues to be the fuel for our growth. 2007 marked the 15th consecutive year of
record revenue and earnings and positive comparable store sales increases since we became a public company in 1993.
COMPARISON OF FIVE-YEAR CUMULATIVE RETURN
o’reilly auto parts
nasdaq retail trade stocks
nasdaq us market 100
200
$ 300
dec. ,
dec. ,
dec. ,
dec. ,
dec. ,
dec. ,
‘03 ‘04 ‘05 ‘06 ‘07
0.92
1.05
1.45
1.55
1.67
‘03 ‘04 ‘05 ‘06 ‘07
100,087
117,674
164,266
178,085
193,988
‘03 ‘04 ‘05 ‘06 ‘07
165,275
190,458
252,524
282,315
305,151