Nutrisystem 2003 Annual Report Download - page 14
Download and view the complete annual report
Please find page 14 of the 2003 Nutrisystem annual report below. You can navigate through the pages in the report by either clicking on the pages listed below, or by using the keyword search tool below to find specific information within the annual report.-
 1
1 -
2
-
3
-
 4
4 -
 5
5 -
 6
6 -
 7
7 -
 8
8 -
 9
9 -
 10
10 -
 11
11 -
 12
12 -
 13
13 -
 14
14 -
 15
15 -
 16
16 -
 17
17 -
 18
18 -
 19
19 -
 20
20 -
 21
21 -
 22
22 -
 23
23 -
 24
24 -
25
-
26
-
27
-
28
-
29
-
30
-
31
-
32
-
33
-
34
-
35
-
36
-
37
-
38
-
39
-
40
-
41
-
42
-
43
-
44
-
45
-
46
-
47
 |
 |

12
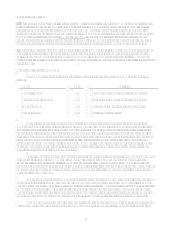
Selected Consolidated Financial Data
(in thousands, except per share data)
Year Ended December 31,
2003 2002 2001 2000 1999
Statement
of Operations Data:
Revenues:
Total revenues.................. $ 22,575 $ 27,569 $ 23,798 $ 20,202 $ 8,584
Costs and expenses:
Cost of revenues........... 13,372 15,653 13,114 11,055 6,196
Marketing..................... 3,627 1,392 3,565 8,432 520
General and
administrative ............
7,239
7,775
6,440
6,088
11,666(a)
New program development.. 599
Depreciation and
amortization ...............
223
336
418
307
99
Operating income (loss) from
continuing operations....
(2,485)
2,413
261
(5,680)
(9,897)
Other income (loss) (100) 77 84
Equity in losses of affiliate (157) (143)
Interest income, net 57 41 98 198 56
Minority interest 208
Income tax provision (benefit) (3,397)(b)
Discontinued operation - 200(c) 813(c) (8,586)(c)
Net income (loss)............. $ 812 $ 2,411 $ 1,249 $ (13,984) $ (9,633)
Basic and diluted earnings (loss)
per share:
Continuing operations..... $0.03 $0.08 $0.01 $(0.19) $ (0.45)
Discontinued operation ... 0.03 (0.03)
Disposal of discontinued operation 0.01 (0.28)
Basic and diluted............ $0.03 $0.09 $0.04 $(0.50) $(0.45)
Weighted average shares outstanding
Basic 26,733 26,475 28,156 28,006 21,449
Diluted 27,064 26,917 28,201 28,006 21,449
December 31,
2003 2002 2001 2000 1999
Balance Sheet Data:
Cash, cash equivalents and
short-term investments............ $ 2,684 $3,005 $1,118 $1,638 $2,902
Working capital ........................ 5,664 4,445 2,310 1,434 3,509
Total assets................................ 13,688 8,277 6,387 5,908 5,856
Non-current liabilities ............... 2 255 123 145 133
Stockholders' equity.................. 9,291 5,249 3,488 2,901 4,391
___________________