Nokia 2010 Annual Report Download - page 76
Download and view the complete annual report
Please find page 76 of the 2010 Nokia annual report below. You can navigate through the pages in the report by either clicking on the pages listed below, or by using the keyword search tool below to find specific information within the annual report.-
 1
1 -
2
-
3
-
4
-
5
-
6
-
7
-
8
-
9
-
10
-
11
-
12
-
13
-
14
-
15
-
16
-
17
-
18
-
19
-
20
-
21
-
22
-
23
-
24
-
25
-
26
-
27
-
28
-
29
-
30
-
31
-
32
-
33
-
34
-
35
-
36
-
37
-
38
-
39
-
40
-
41
-
42
-
43
-
44
-
45
-
46
-
47
-
48
-
49
-
50
-
51
-
52
-
53
-
54
-
55
-
56
-
57
-
58
-
59
-
60
-
61
-
62
-
63
-
64
-
65
-
 66
66 -
 67
67 -
 68
68 -
 69
69 -
 70
70 -
 71
71 -
 72
72 -
 73
73 -
 74
74 -
 75
75 -
 76
76 -
 77
77 -
 78
78 -
 79
79 -
 80
80 -
 81
81 -
 82
82 -
 83
83 -
 84
84 -
 85
85 -
 86
86 -
87
-
88
-
89
-
90
-
91
-
92
-
93
-
94
-
95
-
96
-
97
-
98
-
99
-
100
-
101
-
102
-
103
-
104
-
105
-
106
-
107
-
108
-
109
-
110
-
111
-
112
-
113
-
114
-
115
-
116
-
117
-
118
-
119
-
120
-
121
-
122
-
123
-
124
-
125
-
126
-
127
-
128
-
129
-
130
-
131
-
132
-
133
-
134
-
135
-
136
-
137
-
138
-
139
-
140
-
141
-
142
-
143
-
144
-
145
-
146
-
147
-
148
-
149
-
150
-
151
-
152
-
153
-
154
-
155
-
156
-
157
-
158
-
159
-
160
-
161
-
162
-
163
-
164
-
165
-
166
-
167
-
168
-
169
-
170
-
171
-
172
-
173
-
174
-
175
-
176
-
177
-
178
-
179
-
180
-
181
-
182
-
183
-
184
-
185
-
186
-
187
-
188
-
189
-
190
-
191
-
192
-
193
-
194
-
195
-
196
-
197
-
198
-
199
-
200
-
201
-
202
-
203
-
204
-
205
-
206
-
207
-
208
-
209
-
210
-
211
-
212
-
213
-
214
-
215
-
216
-
217
-
218
-
219
-
220
-
221
-
222
-
223
-
224
-
225
-
226
-
227
-
228
-
229
-
230
-
231
-
232
-
233
-
234
-
235
-
236
-
237
-
238
-
239
-
240
-
241
-
242
-
243
-
244
-
245
-
246
-
247
-
248
-
249
-
250
-
251
-
252
-
253
-
254
-
255
-
256
-
257
-
258
-
259
-
260
-
261
-
262
-
263
-
264
-
265
-
266
-
267
-
268
-
269
-
270
-
271
-
272
-
273
-
274
-
275
 |
 |

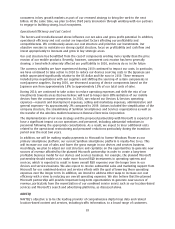
The following is a list of the location, use and capacity of major manufacturing facilities for Nokia
mobile devices and Nokia Siemens Networks infrastructure equipment.
Country Location and Products
Productive
Capacity, Net
(m
2
)
(1)
BRAZIL Manaus: mobile devices 11 752
CHINA Beijing: mobile devices 26 848
Dongguan: mobile devices 35 667
Beijing: switching systems 6 749
Shanghai: base stations, broadband access systems,
transmission systems 16 363
Suzhou: base stations 11 373
FINLAND Salo: mobile devices 17 352
Oulu: base stations 14 000
GERMANY Berlin: optical transmission systems 14 045
Bruchsal: Switching systems, transmission systems,
broadband access systems 23 612
HUNGARY Komárom: mobile devices 44 805
INDIA Chennai: mobile devices 35 581
Chennai: base stations and radio controllers, microwave
radio products. 7 328
Kolkata: fixed switching 9 057
MEXICO Reynosa: mobile devices 19 535
REPUBLIC OF KOREA Masan: mobile devices 31 183
ROMANIA Cluj: mobile devices 15 773
UNITED KINGDOM Fleet: mobile devices 2 728
(1)
Productive capacity equals the total area allotted to manufacturing and to the storage of
manufacturingrelated materials.
ITEM 4A. UNRESOLVED STAFF COMMENTS
Not applicable.
ITEM 5. OPERATING AND FINANCIAL REVIEW AND PROSPECTS
5A. Operating Results
This section begins with an overview of the principal factors and trends affecting our results of
operations. The overview is followed by a discussion of our critical accounting policies and estimates
that we believe are important to understanding the assumptions and judgments reflected in our
reported financial results. We then present an analysis of our results of operations for the last three
fiscal years.
We currently have three operating and reportable segments for financial reporting purposes:
Devices & Services; NAVTEQ; and Nokia Siemens Networks.
On July 10, 2008, we completed the acquisition of NAVTEQ Corporation. NAVTEQ is a separate
reportable segment of Nokia starting from the third quarter 2008. The results of NAVTEQ are not
available for the prior periods. Accordingly, the results of NAVTEQ for the full years 2010 and 2009 are
not directly comparable to the results for the full year 2008.
As of April 1, 2011, we will have a new operational structure, which features two distinct business
units in Devices & Services business: Smart Devices and Mobile Phones. They will focus on our key
business areas: smartphones and massmarket mobile phones. Each unit will have profitandloss
75