Nikon 2012 Annual Report Download - page 7
Download and view the complete annual report
Please find page 7 of the 2012 Nikon annual report below. You can navigate through the pages in the report by either clicking on the pages listed below, or by using the keyword search tool below to find specific information within the annual report.-
 1
1 -
 2
2 -
 3
3 -
 4
4 -
 5
5 -
 6
6 -
 7
7 -
 8
8 -
 9
9 -
 10
10 -
 11
11 -
 12
12 -
 13
13 -
 14
14 -
 15
15 -
 16
16 -
 17
17 -
 18
18 -
19
-
20
-
21
-
22
-
23
-
24
-
25
-
26
-
27
-
28
-
29
-
30
-
31
-
32
-
33
-
34
-
35
-
36
-
37
-
38
-
39
-
40
-
41
-
42
-
43
-
44
-
45
-
46
-
47
-
48
-
49
-
50
-
51
-
52
-
53
-
54
-
55
-
56
-
57
-
58
-
59
-
60
-
61
-
62
-
63
-
64
-
65
-
66
 |
 |

5
NIKON CORPORATION ANNUAL REPORT 2012
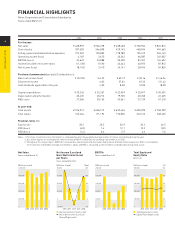
Millions of Yen
Thousands of U.S.
Dollars (Note 2)
2008 2009 2010 2011 2012 2012 2012 Highlights
Net Sales
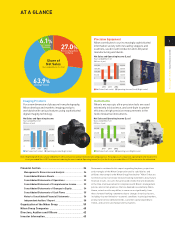
UP 3.5%
Precision Equipment
segment results
helped boost net sales.
Although the Thai
flooding affected the
Imaging segment’s
performance, the
market share of compact
digital cameras grew.
Operating Income
UP 48.2%
Precision Equipment
segment results
contributed to the
considerable gain in
earnings.
Annual Dividend
¥38
Up ¥19 from the
previous fiscal year
¥ 955,792 ¥ 879,719 ¥ 785,499 ¥ 887,513 ¥ 918,652 $ 11,177,174
551,551 561,642 552,409 575,536 567,000 6,898,654
269,072 269,892 246,944 257,924 271,571 3,304,183
135,169 48,185 (13,854) 54,053 80,081 974,337
160,847 81,095 22,102 88,087 112,651 1,370,616
116,704 39,180 (17,672) 46,506 86,168 1,048,406
75,484 28,056 (12,615) 27,313 59,306 721,567
¥ 189.00 ¥ 70.76 ¥ (31.82) ¥ 68.90 ¥ 149.57 $ 1.82
181.23 67.91 68.83 149.41 1.82
25.00 18.00 8.00 19.00 38.00 0.46
¥ 39,829 ¥ 43,467 ¥ 37,525 ¥ 29,776 ¥ 55,915 $ 680,312
25,678 32,910 35,956 34,034 32,570 396,279
58,373 61,489 60,261 60,767 68,701 835,886
¥ 820,622 ¥ 749,805 ¥ 740,632 ¥ 829,909 ¥ 860,230 $ 10,466,364
393,126 379,087 372,070 389,220 433,617 5,275,787
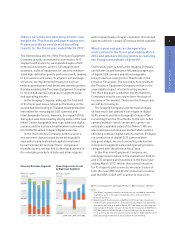
47.9 50.5 50.2 46.9 50.3
20.4 7.3 (3.4) 7.2 14.4
9.6 3.6 (1.7) 3.5 7.0
(%)
2008 2009 2010 2011 2012
25
20
15
10
5
0
-5
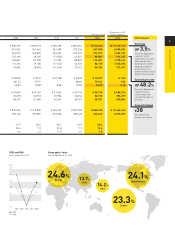
24.1%
United States
23.3%
Others
24.6%
Europe 13.7%
China 14.2%
Japan
ROE and ROA
Years ended March 31
Geographic Sales
Year ended March 31, 2012
ROE
ROA