Nikon 2007 Annual Report Download - page 3
Download and view the complete annual report
Please find page 3 of the 2007 Nikon annual report below. You can navigate through the pages in the report by either clicking on the pages listed below, or by using the keyword search tool below to find specific information within the annual report.-
 1
1 -
 2
2 -
 3
3 -
 4
4 -
 5
5 -
 6
6 -
 7
7 -
 8
8 -
 9
9 -
 10
10 -
 11
11 -
 12
12 -
 13
13 -
 14
14 -
15
-
16
-
17
-
18
-
19
-
20
-
21
-
22
-
23
-
24
-
25
-
26
-
27
-
28
-
29
-
30
-
31
-
32
-
33
-
34
-
35
-
36
-
37
-
38
-
39
-
40
-
41
-
42
-
43
-
44
-
45
-
46
-
47
-
48
-
49
-
50
-
51
-
52
-
53
-
54
 |
 |

07
06
05
04
03
730,944
638,468
506,378
468,959
348,445
243,122
196,030
171,194
162,464
54,825
28,945
24,141
2,410
(8,143)
07
06
05
04
03
07
06
05
04
03
NIKON ANNUAL REPORT 2007 01
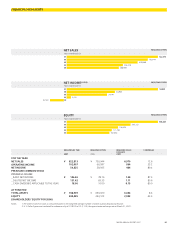
NET SALES MILLIONS OF YEN
NET INCOME (LOSS) MILLIONS OF YEN
EQUITY MILLIONS OF YEN
FINANCIAL HIGHLIGHTS
FOR THE YEAR
NET SALES
OPERATING INCOME
NET INCOME
PER SHARE COMMON STOCK
(YEN AND U.S. DOLLAR):
_ BASIC NET INCOME
_ DILUTED NET INCOME
_ CASH DIVIDENDS APPLICABLE TO THE YEAR
AT YEAR END
TOTAL ASSETS
EQUITY
(SHAREHOLDERS’ EQUITY FOR 2006)
MILLIONS OF YEN
2007
¥ 822,813
102,007
54,825
¥ 146.36
131.42
18.00
¥ 748,939
348,445
MILLIONS OF YEN
2006
¥ 730,944
66,587
28,945
¥78.16
69.33
10.00
¥ 690,920
243,122
MILLIONS OF U.S.
DOLLARS
2007
6,970
864
464
1.24
1.11
0.15
6,344
2,952
% INCREASE
12.6
53.2
89.4
87.3
89.6
80.0
8.4
43.3
Notes: 1. Per share of common stock is computed based on the weighted average number of shares outstanding during the year.
2. U.S. Dollar figures are translated for reference only at ¥118.05 to U.S. $1.00, the approximate exchange rate at March 31, 2007.
Years ended March 31
Years ended March 31
Years ended March 31