Napa Auto Parts 2014 Annual Report Download - page 4
Download and view the complete annual report
Please find page 4 of the 2014 Napa Auto Parts annual report below. You can navigate through the pages in the report by either clicking on the pages listed below, or by using the keyword search tool below to find specific information within the annual report.-
 1
1 -
 2
2 -
 3
3 -
 4
4 -
 5
5 -
 6
6 -
 7
7 -
 8
8 -
 9
9 -
 10
10 -
 11
11 -
 12
12 -
 13
13 -
 14
14 -
 15
15 -
16
-
17
-
18
-
19
-
20
-
21
-
22
-
23
-
24
-
25
-
26
-
27
-
28
-
29
-
30
-
31
-
32
-
33
-
34
-
35
-
36
-
37
-
38
-
39
-
40
-
41
-
42
-
43
-
44
-
45
-
46
-
47
-
48
-
49
-
50
-
51
-
52
-
53
-
54
-
55
-
56
-
57
-
58
-
59
-
60
-
61
-
62
-
63
-
64
-
65
-
66
-
67
-
68
-
69
-
70
-
71
-
72
-
73
-
74
-
75
-
76
-
77
-
78
-
79
-
80
-
81
-
82
-
83
-
84
-
85
-
86
-
87
-
88
-
89
-
90
-
91
-
92
 |
 |

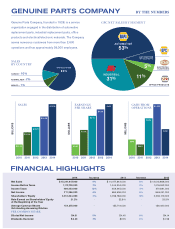
We are pleased to report that 2014 was another year of
record sales and earnings for Genuine Parts Company.
Total Company sales were $15.3 billion, a 9% increase
compared to 2013. Reported net earnings were up 4%
to $711 million and earnings per share were up 5% to
$4.61, compared to 2013. Before the one-time positive
adjustment in 2013 related to the acquisition of GPC
Asia Pacific, net income was up 9% and earnings per
share were up 10%, compared to 2013. The GPC Team
showed progress across all four of our business segments
in 2014. Our automotive operations produced another
year of consistent and steady sales growth, and our
non-automotive businesses rebounded nicely in 2014
after experiencing difficult market conditions in the prior
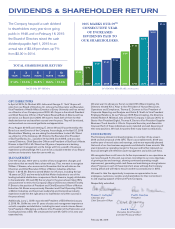
year. We are also pleased to report a solid increase in
the total value of the Company again in 2014. Our stock
price increased 28% for the year and, combined with our
dividend, provided our shareholders with a total return of
31% in 2014. Over the past 10 years, our total return to
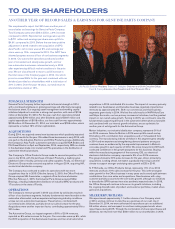
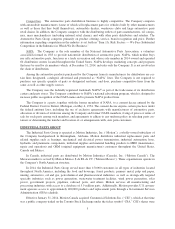
shareholders stands at 13%. L-R: Paul D. Donahue President; Thomas C. Gallagher Chairman and Chief Executive Officer;
Carol B. Yancey Executive Vice President and Chief Financial Officer
FINANCIAL STRENGTH
Genuine Parts Company further improved its financial strength in 2014
with a continued emphasis on growing earnings and effectively managing
the balance sheet. Our ongoing asset management and working capital
initiatives helped us to maintain a strong cash position, with cash of $138
million at December 31, 2014. For the year, cash from operations totaled
approximately $790 million and, after dividends paid of $347 million and
capital expenditures of $108 million, our free cash flow was approximately
$335 million. At December 31, 2014, our total debt was $765 million, which
represents a modest 19% of total capitalization.
ACQUISITIONS
During 2014, we acquired several new businesses which positively impacted
our overall results for the year. We added three businesses in early 2014, with
one each in the Industrial, Electrical and Office Products groups. Additionally,
the Company’s Asia Pacific automotive operations acquired RDA Brakes and
PJL Diesel Electric in April and September, 2014, respectively. RDA is a leader
in the Australian brake rotor market and PJL specializes in the distribution of
automotive electrical products.
The Company’s Office Products Group made its second acquisition of the
year in July 2014, with the purchase of Impact Products, a leading value-
added provider of facility, janitorial and safety supplies. Finally, our Electrical/
Electronic Group made a second acquisition in August 2014, acquiring IWI,
an electrical distribution company.
The Company has continued to add to its operations with two more
acquisitions thus far in 2015. Effective January 2, 2015, the Office Products
Group acquired JAL Associates, a regional office furniture wholesaler.
Effective February 1, 2015, the Industrial Parts Group acquired Miller
Bearings, a leading independent distributor of industrial MRO products with
17 locations in the state of Florida.
OPERATIONS
The Company’s revenue growth in 2014 was driven by solid sales results in
all four of our business segments. Industry fundamentals were favorable in the
automotive aftermarket, and we experienced improving industry conditions
across our non-automotive businesses. These factors, combined with
our internal sales initiatives, partially drove our sales increase for the year.
Acquisitions were another important factor, contributing approximately 5% to
2014 sales.
The Automotive Group, our largest segment at 53% of 2014 revenues,
reported an 8% sales increase for the year. Our core sales were up 6%, while
the 2013 acquisition of the Australasian business and two small automotive
acquisitions in 2014 contributed 4% to sales. The impact of currency primarily
related to our Australasian and Canadian business negatively impacted our
revenues by approximately 2%. Both our commercial and retail business
segments grew nicely in 2014. We feel the solid results in NAPA AutoCare
and Major Accounts, our two primary commercial initiatives, had the greatest
impact on our overall sales growth. Turning to 2015, we continue to view the
fundamentals supporting demand in the automotive aftermarket as favorable
and combined with our internal growth initiatives, we are optimistic for
another year of solid growth for the Automotive Group.
Motion Industries, our industrial distribution company, represents 31% of
our 2014 revenues. Sales for Motion in 2014 were up 8% overall and up
6% before a 3% contribution from acquisitions and a 1% headwind from
currency. The manufacturing indices we follow in this segment grew steadily
in 2014 and we experienced strengthening demand patterns among our
customer base, as evidenced by the sequential improvement in Motion’s
core sales growth in each quarter of 2014. We move forward into 2015 with
continued confidence in the growth prospects for this business. Staying
within the manufacturing segment of the economy, EIS, our electrical/
electronic distribution company, represents 5% of our 2014 revenues.
This group showed a 30% sales increase for the year, driven primarily by
acquisitions. Looking ahead, we expect a gradually improving customer
climate to support stronger underlying sales growth at EIS in 2015.
S. P. Richards, our Office Products Group, represents 11% of our 2014
revenues and had a 10% sales increase for the year. This is the strongest
sales growth for the Office business in many years and is evenly split between
contributions from core sales and acquisitions. New business with a key
customer partially accounts for the core sales growth, although our initiatives
to diversify the SPR business have also positively impacted sales. In 2015,
the Office Group will continue to focus on its growth initiatives, including
the ongoing diversification of product and customer portfolios, market share
gains and acquisitions.
SHARE REPURCHASES
We repurchased approximately 1.1 million shares of our Company stock
in 2014, and we continue to view this as a good use of our cash. As of
December 31, 2014, we were authorized to repurchase up to an additional
9.5 million shares, and we expect to continue making opportunistic share
repurchases during 2015. Through the combination of share repurchases and
dividends, we returned more than $440 million to our shareholders in 2014.
TO OUR SHAREHOLDERS
ANOTHER YEAR OF RECORD SALES & EARNINGS FOR GENUINE PARTS COMPANY