Motorola 2002 Annual Report Download - page 28
Download and view the complete annual report
Please find page 28 of the 2002 Motorola annual report below. You can navigate through the pages in the report by either clicking on the pages listed below, or by using the keyword search tool below to find specific information within the annual report.-
 1
1 -
2
-
3
-
4
-
5
-
6
-
7
-
8
-
9
-
10
-
11
-
12
-
13
-
14
-
15
-
16
-
17
-
 18
18 -
 19
19 -
 20
20 -
 21
21 -
 22
22 -
 23
23 -
 24
24 -
 25
25 -
 26
26 -
 27
27 -
 28
28 -
 29
29 -
 30
30 -
 31
31 -
 32
32 -
 33
33 -
 34
34 -
 35
35 -
 36
36 -
 37
37 -
 38
38 -
39
-
40
-
41
-
42
-
43
-
44
-
45
-
46
-
47
-
48
 |
 |

26 Motorola, Inc. and Subsidiaries
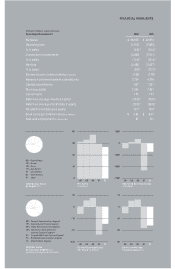
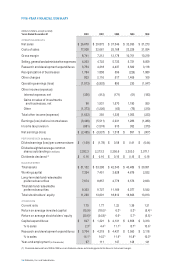
FIVE-YEAR FINANCIAL SUMMARY
(Dollars in millions, except as noted)
Years Ended December 31 2002 2001 2000 1999 1998
OPERATING RESULTS
Net sales $ 26,679 $ 29,873 $ 37,346 $ 32,930 $ 31,273
Costs of sales 17,938 22,661 25,168 22,229 21,054
Gross margin 8,741 7,212 12,178 10,701 10,219
Selling, general and administrative expenses 4,203 4,723 5,733 5,731 6,059
Research and development expenditures 3,754 4,318 4,437 3,560 3,118
Reorganization of businesses 1,764 1,858 596 (226) 1,980
Other charges 833 2,116 517 1,406 109
Operating earnings (loss) (1,813) (5,803) 895 230 (1,047)
Other income (expense):
Interest expense, net (356) (413) (171) (51) (183)
Gains on sales of investments
and businesses, net 96 1,931 1,570 1,180 260
Other (1,373) (1,226) (63) (76) (310)
Total other income (expense) (1,633) 292 1,336 1,053 (233)
Earnings (loss) before income taxes (3,446) (5,511) 2,231 1,283 (1,280)
Income tax provision (961) (1,574) 913 392 (373)
Net earnings (loss) $ (2,485) $ (3,937) $ 1,318 $ 891 $ (907)
PER SHARE DATA (in dollars)
Diluted earnings (loss) per common share $ (1.09) $ (1.78) $ 0.58 $ 0.41 $ (0.44)
Diluted weighted average common
shares outstanding (in millions) 2,282.3 2,213.3 2,256.6 2,202.0 2,071.1
Dividends declared (1) $0.16 $ 0.16 $ 0.16 $ 0.16 $ 0.16
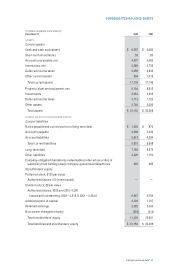
BALANCE SHEET
Total assets $ 31,152 $ 33,398 $ 42,343 $ 40,489 $ 30,951
Working capital 7,324 7,451 3,628 4,679 2,532
Long-term debt and redeemable
preferred securities 7,674 8,857 4,778 3,573 2,633
Total debt and redeemable
preferred securities 9,303 9,727 11,169 6,077 5,542
Total stockholders’ equity 11,239 13,691 18,612 18,693 13,913
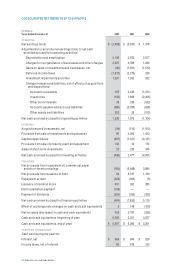
OTHER DATA
Current ratio 1.75 1.77 1.22 1.36 1.21
Return on average invested capital (15.9)%(18.0)%6.3%5.3%(5.4)%
Return on average stockholders’ equity (20.6)%(24.8)%6.6%5.7%(6.5)%
Capital expenditures $ 607 $ 1,321 $ 4,131 $ 2,856 $ 3,313
% to sales 2.3%4.4%11.1%8.7%10.6%
Research and development expenditures $ 3,754 $ 4,318 $ 4,437 $ 3,560 $ 3,118
% to sales 14.1%14.5%11.9%10.8%10.0%
Year-end employment (in thousands) 97 111 147 128 141
(1) Dividends declared from 1998 to 1999 w ere on M otorola shares outstanding prior to the General Instrument merger.