Medtronic 2012 Annual Report Download - page 4
Download and view the complete annual report
Please find page 4 of the 2012 Medtronic annual report below. You can navigate through the pages in the report by either clicking on the pages listed below, or by using the keyword search tool below to find specific information within the annual report.-
 1
1 -
 2
2 -
 3
3 -
 4
4 -
 5
5 -
 6
6 -
 7
7 -
 8
8 -
 9
9 -
 10
10 -
 11
11 -
 12
12 -
 13
13 -
 14
14 -
 15
15 -
16
-
17
-
18
-
19
-
20
-
21
-
22
-
23
-
24
-
25
-
26
-
27
-
28
-
29
-
30
-
31
-
32
-
33
-
34
-
35
-
36
-
37
-
38
-
39
-
40
-
41
-
42
-
43
-
44
-
45
-
46
-
47
-
48
-
49
-
50
-
51
-
52
-
53
-
54
-
55
-
56
-
57
-
58
-
59
-
60
-
61
-
62
-
63
-
64
-
65
-
66
-
67
-
68
-
69
-
70
-
71
-
72
-
73
-
74
-
75
-
76
-
77
-
78
-
79
-
80
-
81
-
82
-
83
-
84
-
85
-
86
-
87
-
88
-
89
-
90
-
91
-
92
-
93
-
94
-
95
-
96
-
97
-
98
-
99
-
100
-
101
-
102
-
103
-
104
-
105
-
106
-
107
-
108
-
109
-
110
-
111
-
112
-
113
-
114
-
115
-
116
-
117
-
118
-
119
-
120
-
121
-
122
-
123
-
124
-
125
-
126
-
127
-
128
-
129
-
130
-
131
-
132
-
133
-
134
-
135
-
136
-
137
-
138
-
139
-
140
-
141
-
142
-
143
-
144
-
145
-
146
-
147
-
148
-
149
-
150
-
151
-
152
 |
 |

U.S.
CardioVascular
Cardiac Rhythm
Disease
Management
Surgical Technologies
Diabetes
Neuromodulation
Spinal
Asia Pacific
South Asia
Greater China
Latin America
Middle East and Africa
Western Europe
and Canada
Central and Eastern Europe
$3.50
3.00
2.50
2.00
1.50
1.00
0.50
0
Diluted Earnings
Per Share
(
in dollars)
(
in dollars)
(
’08
’09
’10
+
‘11
’12
Excluding special charges, restructuring charges, net, certain litigation charges, net, certain acquisition-related items,
non-cash charge to interest expense due to the accounting rules governing convertible debt, certain tax adjustments,
and Physio-Control divestiture-related items.
As
reported
5-year CAGR* for diluted earnings per share, excluding special charges, restructuring charges, net, certain litigation
charges, net, certain acquisition-related items, non-cash charge to interest expense due to the accounting rules
char
governing convertible debt, certain tax adjustments, and Physio-Control divestiture-related items 7.4%.
governing con
5-year CAGR* for diluted earnings per share, as reported 16.2%.
*Compound Annual Growth Rate
+
53-week year
0
$2.5
2.0
1.5
1.0
.5
’08
’09
’10
+
‘11
’12
Return to Shareholders
(dividends issued and shares repurchased,
dollars in billions)
0
$1.5
1.2
0.9
0.6
0.3
R
e
s
e
a
r
c
h a
n
d
D
e
v
elop
m
ent
E
x
p
en
s
e
(
dollars in billions)
(
dollars in billions)
(
’08
’09
’10
+
‘11
5-year
CAGR
4.6%
’12
0
$16
12
8
4
’08
’09
’10
+
‘11
5-year
CAGR*
5.3%
’12
N
e
t
S
ales
(
dollars in billions)
(
dollars in billions)
(
55%
25%
2%
10%
4%
1%
1% 2%
31%
21%
20%
11%
9%
8%
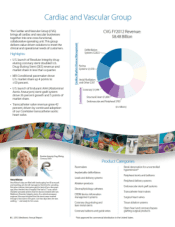
Cardiac and
Vascular Group
Restorative
Therapies Group
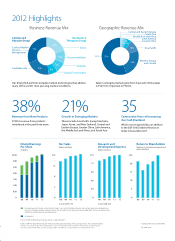
Geographic Revenue MixBusiness Revenue Mix
2012 Highlights
21%
Growth in Emerging Markets
These include Asia Pacific (except Australia,
Japan, Korea, and New Zealand), Central and
Eastern Europe, Greater China, Latin America,
the Middle East and Africa, and South Asia.
35
Consecutive Years of Increasing
Our Cash Dividend
Which was recognized by our addition
to the S&P 500 Dividend Aristocrat
Index in December 2011.
38%
Revenue from New Products
FY2012 revenue from products
introduced in the past three years.
Sales in emerging markets grew from 9 percent of total sales
in FY2011 to 10 percent in FY2012.
Our diversified portfolio includes medical technologies that address
many of the world’s most pressing medical conditions.