Medtronic 2009 Annual Report Download - page 5
Download and view the complete annual report
Please find page 5 of the 2009 Medtronic annual report below. You can navigate through the pages in the report by either clicking on the pages listed below, or by using the keyword search tool below to find specific information within the annual report.-
 1
1 -
 2
2 -
 3
3 -
 4
4 -
 5
5 -
 6
6 -
 7
7 -
 8
8 -
 9
9 -
 10
10 -
 11
11 -
 12
12 -
 13
13 -
 14
14 -
 15
15 -
 16
16 -
17
-
18
-
19
-
20
-
21
-
22
-
23
-
24
-
25
-
26
-
27
-
28
-
29
-
30
-
31
-
32
-
33
-
34
-
35
-
36
-
37
-
38
-
39
-
40
-
41
-
42
-
43
-
44
-
45
-
46
-
47
-
48
-
49
-
50
-
51
-
52
-
53
-
54
-
55
-
56
-
57
-
58
-
59
-
60
-
61
-
62
-
63
-
64
-
65
-
66
-
67
-
68
-
69
-
70
-
71
-
72
-
73
-
74
-
75
-
76
-
77
-
78
-
79
-
80
-
81
-
82
-
83
-
84
-
85
-
86
-
87
-
88
-
89
-
90
-
91
-
92
-
93
-
94
-
95
-
96
-
97
-
98
-
99
-
100
-
101
-
102
-
103
-
104
-
105
-
106
 |
 |

*Compound Annual Growth Rate
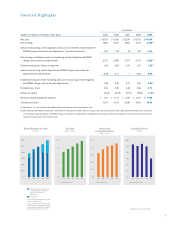
Net Sales
(dollars in billions)
’05 ’06 ’07 ’08 ’09
5-year CAGR* 9.9%
0
3
6
9
12
$15
Research and
Development Expense
(dollars in billions)
’05 ’06 ’07 ’08 ’09
5-year CAGR* 9.7%
0
0.3
0.6
0.9
1.2
$1.5
Closing Stock Price
(in dollars)
’05 ’06 ’07 ’08 ’09
5-year CAGR* (10.1)%
0
10
20
30
40
50
$60
Excluding special, restructuring,
certain litigation and IPR&D
charges and certain tax
adjustments
As reported
5-year CAGR* for diluted earnings per
share, as reported 3.8%
5-year CAGR* for diluted earnings per
share, excluding special, restructuring,
certain litigation and IPR&D charges
and certain tax adjustments 12.4%
Diluted Earnings Per Share
(in dollars)
’05 ’06 ’07 ’08 ’09
0
0.50
1.00
1.50
2.00
2.50
$3.00
Financial Highlights
Fiscal Year
(dollars in millions, except per share data) 2005 2006 2007 2008 2009
Net sal es $ 10,055 $ 11,292 $ 12,299 $ 13,515 $ 14,599
Net earnings 1,804 2,547 2,802 2,231 2,169(2)
Special, restructuring, certain litigation and in-process research and development
(IPR&D) charges and certain tax adjustments(1) (net of income taxes) 467 136 (5) 742 1,114
Net earnings excluding special, restructuring, certain litigation and IPR&D
charges and certain tax adjustments 2,271 2,683 2,797 2,973 3,283(2)
Diluted earnings per share, as reported 1.48 2.09 2.41 1.95 1.93(2)
Special, restructuring, certain litigation and IPR&D charges and certain tax
adjustments per diluted share 0.38 0.11 — 0.65 0.99
Diluted earnings per share excluding special, restructuring, certain litigation
and IPR&D charges and certain tax adjustments 1.86 2.20 2.41 2.60 2.92(2)
Dividends per share 0.34 0.39 0.44 0.50 0.75
Return on equity 18.5% 25.7% 27.5% 19.8% 17.8%
Research and development expense $ 951 $ 1,113 $ 1,239 $ 1,275 $ 1,355
Closing stock price 52.70 50.12 53.60 49.42 29.58
(1) See Notes 2, 3, 4 and 13 to the consolidated financial statements for further discussion.
(2) Net earnings and diluted earnings per share decreased by 3 percent and 1 percent, respectively, over the prior year. After adjusting for the impact due to special,
restructuring, certain litigation and IPR&D charges and certain tax adjustments, adjusted net earnings and diluted earnings per share increased 10 percent and
12 percent, respectively, over the prior year.
1