McKesson 2012 Annual Report Download - page 3
Download and view the complete annual report
Please find page 3 of the 2012 McKesson annual report below. You can navigate through the pages in the report by either clicking on the pages listed below, or by using the keyword search tool below to find specific information within the annual report.-
 1
1 -
 2
2 -
 3
3 -
 4
4 -
 5
5 -
 6
6 -
 7
7 -
 8
8 -
 9
9 -
 10
10 -
 11
11 -
 12
12 -
 13
13 -
 14
14 -
15
-
16
-
17
-
18
-
19
-
20
-
21
-
22
-
23
-
24
-
25
-
26
-
27
-
28
-
29
-
30
-
31
-
32
-
33
-
34
-
35
-
36
-
37
-
38
-
39
-
40
-
41
-
42
-
43
-
44
-
45
-
46
-
47
-
48
-
49
-
50
-
51
-
52
-
53
-
54
-
55
-
56
-
57
-
58
-
59
-
60
-
61
-
62
-
63
-
64
-
65
-
66
-
67
-
68
-
69
-
70
-
71
-
72
-
73
-
74
-
75
-
76
-
77
-
78
-
79
-
80
-
81
-
82
-
83
-
84
-
85
-
86
-
87
-
88
-
89
-
90
-
91
-
92
-
93
-
94
-
95
-
96
-
97
-
98
-
99
-
100
-
101
-
102
-
103
-
104
-
105
-
106
-
107
-
108
-
109
-
110
-
111
-
112
-
113
-
114
-
115
-
116
-
117
-
118
-
119
-
120
-
121
-
122
-
123
-
124
-
125
-
126
-
127
-
128
 |
 |

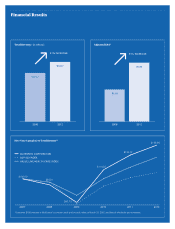
McKesson grew revenues to a record $122.7 billion, an increase
of 10%. Full-year adjusted earnings per diluted share was $6.38*,
up 20%, and cash flow from operations totaled $2.9 billion. We
ended fiscal year 2012 with cash and cash equivalents of $3.1 billion,
providing the financial strength and flexibility to make investments
that position us for future growth.
Distribution Solutions fueled our strong performance, with revenues
for the segment up 10% and adjusted operating profit up 13%*. U.S.
pharmaceutical distribution revenues also increased 10%, reflecting
market growth and new business with existing customers. We are
particularly proud that the Department of Veterans Affairs renewed
its distribution agreement with McKesson, enabling us to continue
serving our nation’s veterans. Across the distribution segment,
we enhanced our value to customers through our unmatched service
levels, global sourcing capabilities and customized solution offerings.
In Technology Solutions, we increased revenues 4% to $3.3 billion
and grew adjusted operating profit by 21%*. We continued to
expand our solution set for hospitals and health systems, payers,
pharmacies and physician practices, with a focus on helping them
use information technology to address their financial, clinical and
integration needs. We are working closely with our customers in all
markets to help them prepare for near-term requirements and to
position them for long-term success in a world of evolving payment
models, greater consumer empowerment and increased pressure
to improve quality and efficiency.
Throughout the year, we used our strong balance sheet and cash
flow to create value for our stockholders. Among the many highlights,
we acquired the independent banner and franchise businesses
of the Katz Group Canada Inc., extending our market leadership
in Canada. Looking forward, we plan to continue our portfolio
approach to capital deployment with a mix of acquisitions, share
repurchases, dividends and internal capital spending.
Fiscal 2013 will mark McKesson’s 180th year as a company, and
I am more optimistic than ever about our future. Working in
partnership with our customers and suppliers, McKesson is uniquely
positioned to help improve the business and clinical performance
of all sectors of the industry, leading to better care for patients, and
ultimately better health for all. On behalf of the Board of Directors
and our employees, thank you for your commitment to McKesson.
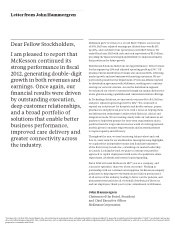
John Hammergren
Chairman of the Board, President
and Chief Executive Offi cer
McKesson Corporation
Letter from John Hammergren
Dear Fellow Stockholders,
I am pleased to report that
McKesson continued its
strong performance in fi scal
2012, generating double-digit
growth in both revenues and
earnings. Once again, our
fi nancial results were driven
by outstanding execution,
deep customer relationships,
and a broad portfolio of
solutions that enable better
business performance,
improved care delivery and
greater connectivity across
the industry.
*See Appendix A to this 2012 Annual Report for a reconciliation of earnings per share and operating profit as reported under U.S. generally accepted accounting principles (“GAAP”) to adjusted earnings per
share and adjusted operating profit. Non-GAAP measures such as adjusted earnings per share and adjusted operating profit should be viewed in addition to, and not as an alternative for, financial results
prepared in accordance with GAAP.