MasterCard 2012 Annual Report Download - page 61
Download and view the complete annual report
Please find page 61 of the 2012 MasterCard annual report below. You can navigate through the pages in the report by either clicking on the pages listed below, or by using the keyword search tool below to find specific information within the annual report.-
 1
1 -
2
-
3
-
4
-
5
-
6
-
7
-
8
-
9
-
10
-
11
-
12
-
13
-
14
-
15
-
16
-
17
-
18
-
19
-
20
-
21
-
22
-
23
-
24
-
25
-
26
-
27
-
28
-
29
-
30
-
31
-
32
-
33
-
34
-
35
-
36
-
37
-
38
-
39
-
40
-
41
-
42
-
43
-
44
-
45
-
46
-
47
-
48
-
49
-
50
-
 51
51 -
 52
52 -
 53
53 -
 54
54 -
 55
55 -
 56
56 -
 57
57 -
 58
58 -
 59
59 -
 60
60 -
 61
61 -
 62
62 -
 63
63 -
 64
64 -
 65
65 -
 66
66 -
 67
67 -
 68
68 -
 69
69 -
 70
70 -
 71
71 -
72
-
73
-
74
-
75
-
76
-
77
-
78
-
79
-
80
-
81
-
82
-
83
-
84
-
85
-
86
-
87
-
88
-
89
-
90
-
91
-
92
-
93
-
94
-
95
-
96
-
97
-
98
-
99
-
100
-
101
-
102
-
103
-
104
-
105
-
106
-
107
-
108
-
109
-
110
-
111
-
112
-
113
-
114
-
115
-
116
-
117
-
118
-
119
-
120
-
121
-
122
-
123
-
124
-
125
-
126
-
127
-
128
-
129
-
130
-
131
-
132
-
133
-
134
-
135
-
136
-
137
-
138
-
139
-
140
-
141
-
142
-
143
-
144
 |
 |

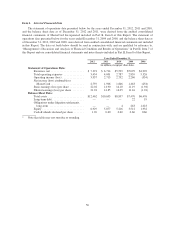
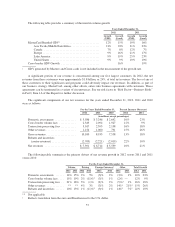
The following table provides a summary of the trend in volume growth:
Years Ended December 31,
2012 2011
Growth
(USD)
Growth
(Local)
Growth
(USD)
Growth
(Local)
MasterCard Branded GDV1........................... 12% 15% 19% 16%
Asia Pacific/Middle East/Africa .................... 21% 23% 31% 23%
Canada ....................................... 7% 8% 12% 7%
Europe ........................................ 9% 16% 21% 17%
Latin America .................................. 9% 19% 25% 23%
United States ................................... 9% 9% 10% 10%
Cross-border GDV Growth ........................... 16% 19%
1GDV generated by Maestro and Cirrus cards is not included in the measurement of the growth rate.
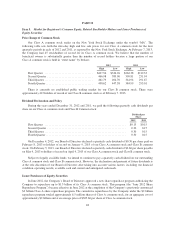
A significant portion of our revenue is concentrated among our five largest customers. In 2012, the net
revenues from these customers were approximately $1.8 billion, or 24%, of total net revenues. The loss of any of
these customers or their significant card programs could adversely impact our revenues. In addition, as part of
our business strategy, MasterCard, among other efforts, enters into business agreements with customers. These
agreements can be terminated in a variety of circumstances. See our risk factor in “Risk Factor—Business Risks”
in Part I, Item 1A of this Report for further discussion.
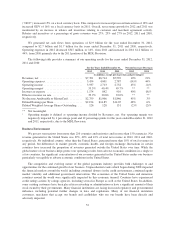
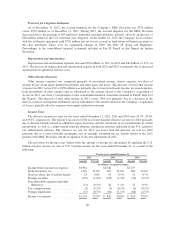
The significant components of our net revenues for the years ended December 31, 2012, 2011 and 2010
were as follows:
For the Years Ended December 31, Percent Increase (Decrease)
2012 2011 2010 2012 2011
(in millions, except percentages)
Domestic assessments ............... $ 3,586 $ 3,246 $ 2,642 10% 23%
Cross-border volume fees ............ 2,343 2,094 1,927 12% 9%
Transaction processing fees ........... 3,017 2,595 2,198 16% 18%
Other revenues ..................... 1,154 1,000 791 15% 26%
Gross revenues ..................... 10,100 8,935 7,558 13% 18%
Rebates and incentives
(contra-revenues) ................. (2,709) (2,221) (2,019) 22% 10%
Net revenues ...................... $ 7,391 $ 6,714 $ 5,539 10% 21%
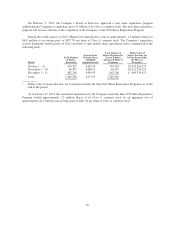
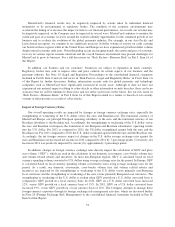
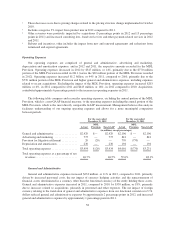
The following table summarizes the primary drivers of net revenue growth in 2012 versus 2011 and 2011
versus 2010:
For the Years Ended December 31,
Volume Pricing Foreign Currency1Other Total Growth
2012 2011 2012 2011 2012 2011 2012 2011 2012 2011
Domestic assessments ...... 14% 15% 2% 5% (3)% 2% (3)% 1% 10% 23%
Cross-border volume fees .... 15% 19% 2% (11)%2(3)% 1% (2)% — 12% 9%
Transaction processing fees . . 21% 16% 3% (1)% (3)% 2% (5)%31% 16% 18%
Other revenues ............ ** ** 4% 3% (3)% 2% 14%421%415% 26%
Rebates and incentives ...... 10% 13% 1% (11)%2(3)% 1% 14%57%522% 10%
** Not applicable
1Reflects translation from the euro and Brazilian real to the U.S. dollar.
57