MasterCard 2011 Annual Report Download - page 65
Download and view the complete annual report
Please find page 65 of the 2011 MasterCard annual report below. You can navigate through the pages in the report by either clicking on the pages listed below, or by using the keyword search tool below to find specific information within the annual report.-
 1
1 -
2
-
3
-
4
-
5
-
6
-
7
-
8
-
9
-
10
-
11
-
12
-
13
-
14
-
15
-
16
-
17
-
18
-
19
-
20
-
21
-
22
-
23
-
24
-
25
-
26
-
27
-
28
-
29
-
30
-
31
-
32
-
33
-
34
-
35
-
36
-
37
-
38
-
39
-
40
-
41
-
42
-
43
-
44
-
45
-
46
-
47
-
48
-
49
-
50
-
51
-
52
-
53
-
54
-
 55
55 -
 56
56 -
 57
57 -
 58
58 -
 59
59 -
 60
60 -
 61
61 -
 62
62 -
 63
63 -
 64
64 -
 65
65 -
 66
66 -
 67
67 -
 68
68 -
 69
69 -
 70
70 -
 71
71 -
 72
72 -
 73
73 -
 74
74 -
 75
75 -
76
-
77
-
78
-
79
-
80
-
81
-
82
-
83
-
84
-
85
-
86
-
87
-
88
-
89
-
90
-
91
-
92
-
93
-
94
-
95
-
96
-
97
-
98
-
99
-
100
-
101
-
102
-
103
-
104
-
105
-
106
-
107
-
108
-
109
-
110
-
111
-
112
-
113
-
114
-
115
-
116
-
117
-
118
-
119
-
120
-
121
-
122
-
123
-
124
-
125
-
126
-
127
-
128
-
129
-
130
-
131
-
132
-
133
-
134
-
135
-
136
-
137
-
138
-
139
-
140
-
141
-
142
-
143
-
144
-
145
-
146
-
147
-
148
-
149
-
150
-
151
-
152
-
153
-
154
-
155
-
156
 |
 |
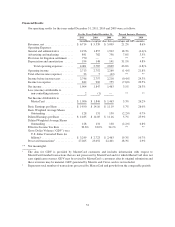
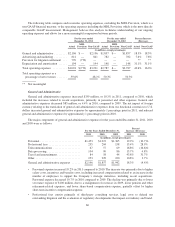
Professional fees increased 15.4% in 2011 versus 2010 primarily due to the legal costs related to
regulatory developments, consulting expenses associated with recent acquisitions and other strategic
initiatives. Professional fees increased 28.9% in 2010 versus 2009 driven by costs including the
evaluation and execution of acquisitions, e-Commerce and other strategic initiatives.
• Telecommunications and data processing expense consist of expenses to support our global payments
network infrastructure, expenses to operate and maintain our computer systems and other
telecommunication needs. These expenses vary with business volume growth, system upgrades and
usage.
• Travel and entertainment expenses are incurred primarily for travel to customer and regional meetings,
business development efforts and strategic initiatives. The 2011 increase in travel and entertainment
expense versus 2010 was primarily due to higher travel costs from strategic initiatives and business
development efforts. The 2010 increase in travel and entertainment versus 2009 was primarily due to
business development efforts.
• Other expenses include rental expense for our facilities, foreign exchange gains and losses, litigation
settlements not related to the MDL Provision and other miscellaneous operating expenses. The 2011
increase in other expenses versus 2010 was primarily due to increased operational expenses in
connection with the Company’s strategic initiatives, including the recent acquisitions, partially offset by
gains from foreign exchange risk management. The 2010 increase in other expenses versus 2009 was
primarily due to foreign currency remeasurement and foreign exchange risk management related to the
DataCash acquisition and the write-off of an uncollectible receivable.
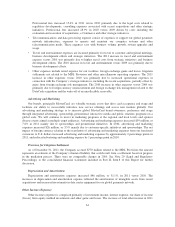
Advertising and Marketing
Our brands, principally MasterCard, are valuable strategic assets that drive card acceptance and usage and
facilitate our ability to successfully introduce new service offerings and access new markets globally. Our
advertising and marketing strategy is to increase global MasterCard brand awareness, preference and usage
through integrated advertising, sponsorship, promotional, interactive media and public relations programs on a
global scale. We will continue to invest in marketing programs at the regional and local levels and sponsor
diverse events aimed at multiple target audiences. Advertising and marketing expenses increased $59 million, or
7.6% in 2011 mainly due to sponsorships and promotional initiatives. In 2010, advertising and marketing
expenses increased $26 million, or 3.5% mainly due to customer-specific initiatives and sponsorships. The net
impact of foreign currency relating to the translation of advertising and marketing expenses from our functional
currencies to U.S. dollars increased advertising and marketing expenses by approximately 2 percentage points in
2011, and reduced advertising and marketing expense by 1 percentage point in 2010.
Provision for Litigation Settlement
As of December 31, 2011, the Company accrued $770 million related to the MDL Provision; the amount
represents an estimate of the Company’s financial liability that could result from a settlement based on progress
in the mediation process. There were no comparable charges in 2010. See Note 20 (Legal and Regulatory
Proceedings) to the consolidated financial statements included in Part II, Item 8 of this Report for further
discussion.
Depreciation and Amortization
Depreciation and amortization expenses increased $46 million, or 31.1%, in 2011 versus 2010. The
increases in depreciation and amortization expense reflected the amortization of intangible assets from recent
acquisitions and increased investments in data center equipment for our global payments network.
Other Income (Expense)
Other income (expense) is comprised primarily of investment income, interest expense, our share of income
(losses) from equity method investments and other gains and losses. The increase of total other income in 2011
61