Marks and Spencer 2011 Annual Report Download - page 13
Download and view the complete annual report
Please find page 13 of the 2011 Marks and Spencer annual report below. You can navigate through the pages in the report by either clicking on the pages listed below, or by using the keyword search tool below to find specific information within the annual report.-
 1
1 -
2
-
 3
3 -
 4
4 -
 5
5 -
 6
6 -
 7
7 -
 8
8 -
 9
9 -
 10
10 -
 11
11 -
 12
12 -
 13
13 -
 14
14 -
 15
15 -
 16
16 -
 17
17 -
 18
18 -
 19
19 -
 20
20 -
 21
21 -
 22
22 -
 23
23 -
24
-
25
-
26
-
27
-
28
-
29
-
30
-
31
-
32
-
33
-
34
-
35
-
36
-
37
-
38
-
39
-
40
-
41
-
42
-
43
-
44
-
45
-
46
-
47
-
48
-
49
-
50
-
51
-
52
-
53
-
54
-
55
-
56
-
57
-
58
-
59
-
60
-
61
-
62
-
63
-
64
-
65
-
66
-
67
-
68
-
69
-
70
-
71
-
72
-
73
-
74
-
75
-
76
-
77
-
78
-
79
-
80
-
81
-
82
-
83
-
84
-
85
-
86
-
87
-
88
-
89
-
90
-
91
-
92
-
93
-
94
-
95
-
96
-
97
-
98
-
99
-
100
-
101
-
102
-
103
-
104
-
105
-
106
-
107
-
108
-
109
-
110
-
111
-
112
-
113
-
114
-
115
-
116
 |
 |

Underlying Group profit before tax
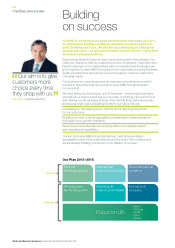
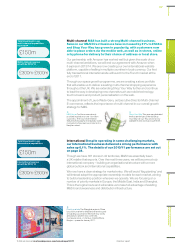
M&S Direct sales*
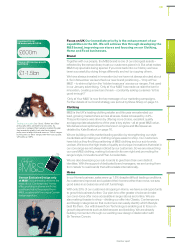
Percentage of population within a 30 minute
drive of a full line store
International sales*
Improve carbon efficiency
in tonnes CO2e per 1,000 sq ft of salesfloor
Improve store energy efficiency
in kWh per sq f t of salesfloor
Send no operational waste to landfill
in tonnes
£543m
93%
£1,007.3m
Becoming a leading multi-channel retailer
Building an international company
Making Plan A how we do business
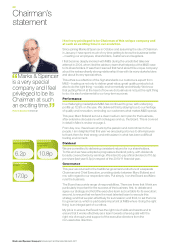
Group profit before tax
09/10 £702.7m
08/09 £706.2m
07/08 £1,129.1m
09/10 £694.6m
08/09 £604.4m
07/08 £1,007.1m
09/10 33.0p
08/09 28.0p
07/08 43.6p
09/10 £413m
08/09 £324m
07/08 £220m
09/10 £949.4m
08/09 £897.8m
07/08 £712.9m
Underlying earnings per share
Analysis Our Multi-channel business continues to grow as we introduce
new and more convenient ways to shop with M&S. This year we announced
plans to invest £150m in our multi-channel capabilities and have targeted
sales growth of £300m to £500m by 2013/14.
* 52 week comparative
Analysis Under our space growth programme, our aim is for 95% of the
population to be within a 30 minute drive of a full line store by 2015. Thiswill
help to ensure we can deliver a leading multi-channel shopping experience
throughout the UK.
Analysis Over the next three years we will invest £150m to strengthen
our international capabilities and make M&S a truly international company.
In line with these plans we have set a target to increase International sales
by £300 to £500m by 2013/14.
* 52 week comparative
Store, office, warehouse, business travel and logistics carbon dioxide
emissions in tonnes CO2e per 1,000 sq ft of salesfloor. Residual emissions
will be of fset by 2012.
Why carbon efficiency? Improving carbon efficiency reduces greenhouse
emissions and costs.
Store energy usage in kWh/sq ft of salesfloor
Why energy efficiency? Improving energy efficiency reduces costs and
helps to meet the requirements of new legislation effective from 2011.
Waste sent to landfill from M&S stores, offices and warehouses in tonnes.
Why no waste to landfill? Sending no waste to landfill will reduce costs in the
longer term and help reduce carbon emissions.
P26
P28
P30
£714.3m +2.8% (53 wks)
+12.9% (52 wks)
+11.1% (53 wks)
+21.9% (52 wks)
+5.5% (53 wks)
+16.0% (52 wks)
£780.6m 34.8p
+31%
The statutory results for the prior year are for the 53 weeks ended 3 April
2010. In order to be able to compare these with this year’s 52 week period,
where appropriate, the 52 week comparative results have been stated.
The Financial review on page 35 explains the calculation of the 52 week
results in 2009/10. The underlying profit measures are consistent with
how the underlying business is measured internally. For more details see
page 36 of the Financial review.
+6.1%
2006/07
51
2012 target
0
2010/11
38
Improvement
25%
2006/07
67.9
2012 target
51
2010/11
52
Improvement
23%
2008/09
69,000
2012 target
0
2010/11
5,000
Improvement
93%
Strategy Operating review Financial review Governance
Financial statements
& other informationPerformance & MarketplaceOverview
To find out more visit marksandspencer.com/annualreport2011 Directors’ report
11