Marks and Spencer 2001 Annual Report Download - page 4
Download and view the complete annual report
Please find page 4 of the 2001 Marks and Spencer annual report below. You can navigate through the pages in the report by either clicking on the pages listed below, or by using the keyword search tool below to find specific information within the annual report.-
 1
1 -
 2
2 -
 3
3 -
 4
4 -
 5
5 -
 6
6 -
 7
7 -
 8
8 -
 9
9 -
 10
10 -
 11
11 -
 12
12 -
 13
13 -
 14
14 -
 15
15 -
16
-
17
-
18
-
19
-
20
-
21
-
22
-
23
-
24
-
25
-
26
-
27
-
28
-
29
-
30
-
31
-
32
-
33
-
34
-
35
-
36
-
37
-
38
-
39
-
40
-
41
-
42
-
43
-
44
 |
 |

4Marks and Spencer p.l.c.
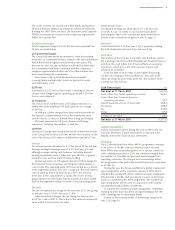
At the end of March 2001 we had 303 stores (including three
outlet stores which opened during the year) with a selling space
of 12.4m sq ft compared with 12.3m sq ft the previous year.
The UK shape of the chain, based on closing footage, is
shown below:
Net achieved margin
Within clothing, results of better buying practices were seen
in a substantially improved primary margin. The net achieved
margin percentage improved over last year’s level, despite a
significant increase in the cost of markdowns.
Operating costs
The increase in UK Retail operating costs was contained to
3.2% (on a 52-week comparative basis). The main components
of the increase were:
(i) higher property-related costs as a result of the concept store
rollout (£13.0m);
(ii) merchant service fees payable on third party credit card
transactions (£9.0m) and inter-company fees payable to
the Financial Services division for the acceptance of the
Marks & Spencer Chargecard (£16.2m), this latter charge
being treated as income in the results of the division. The
charges date from the acceptance of third party credit
cards in April 2000.
International Retail
The International Retail business consists of three broad
geographic areas: Europe (including the Republic of Ireland),
North America and the Far East.
The results from our Franchise businesses which, at 31 March
2001, operated 125 franchise stores in 26 countries, are also
incorporated in the reported performance of International Retail.
Financial information given in paragraphs (a) to (c) below
for financial year 2000 covers a 52-week trading period and has
been calculated using constant exchange rates.
(a) Europe (excluding UK)
An analysis of sales and operating profit before exceptional
charges is shown below.
Turnover Operating profit/(loss)
2001 2000 2001 2000
£m £m £m £m
Continental Europe 285.0 278.6 (34.0) (26.0)
Republic of Ireland
and franchises 263.3 251.3 22.6 17.2
Total Europe 548.3 529.9 (11.4) (8.8)
At 31 March 2001, the Group traded in 45 stores excluding
franchises (last year 40 stores), covering 1,563k sq ft (last year
1,517k sq ft).
(b) North America
The Group operates two businesses in North America:
Brooks Brothers and Kings Super Markets. An analysis of
sales and operating profit is shown below.
Turnover Operating profit
2001 2000 2001 2000
£m £m £m £m
Brooks Brothers 448.1 427.3 20.2 6.4
Kings Super Markets 313.1 294.6 11.9 11.8
Corporate costs ––(0.1) (2.8)
Total North America 761.2 721.9 32.0 15.4
At 31 March 2001, Brooks Brothers traded in 221 stores
(last year 222 stores) and 1,011k sq ft (last year 991k sq ft);
Kings Super Markets operated 27 stores (last year 25 stores)
with 453k sq ft (last year 430k sq ft).
(c) Far East
Sales increased by approximately 4% to £110.1m (last year
£105.9m), and operating profit to £7.4m (last year loss of £4.8m).
At 31 March 2001 we traded in 10 stores in Hong Kong with
aggregate footage of 202k sq ft (last year 223k sq ft).
(d) International restructure
On 29 March 2001, the Group announced the intention to:
•close all European subsidiary operations, with the exception
of the Republic of Ireland and the franchises. The closures
would represent 41 stores and 1,264k sq ft;
•convert our wholly owned subsidiary operation in
Hong Kong to a franchise; and
•sell Brooks Brothers and Kings Super Markets.
Financial Services
This operating division includes six profit centres:
Store Cards
Personal Lending
Unit Trusts
Life Assurance
Personal Insurance
MS Insurance
The overall results are given in the segmental analysis (see note 2,
page 24).
The first five of the six profit centres are managed as a single
operation (the results for the Life Assurance company being
aggregated on an Embedded Value basis). MS Insurance derives
the majority of its underwriting business from the other
Financial Services activities.
The scale of current business levels is indicated below:
Account Personal Unit Life
Cards Lending Trusts Assurance
Number of accounts/
policy holders (000s)
2001 5,009 548 174 80
2000 5,101 567 186 58
Customer outstandings/funds
under management (£m)
2001 634 1,625 1,042 n/a
2000 646 1,495 1,166 n/a
Financial review
Departmental Stores 38.2%
Regional Centres 27.8%
Small Stores 15.7%
High Street Stores 18.3%