Lenovo 2016 Annual Report Download - page 116
Download and view the complete annual report
Please find page 116 of the 2016 Lenovo annual report below. You can navigate through the pages in the report by either clicking on the pages listed below, or by using the keyword search tool below to find specific information within the annual report.-
 1
1 -
2
-
3
-
4
-
5
-
6
-
7
-
8
-
9
-
10
-
11
-
12
-
13
-
14
-
15
-
16
-
17
-
18
-
19
-
20
-
21
-
22
-
23
-
24
-
25
-
26
-
27
-
28
-
29
-
30
-
31
-
32
-
33
-
34
-
35
-
36
-
37
-
38
-
39
-
40
-
41
-
42
-
43
-
44
-
45
-
46
-
47
-
48
-
49
-
50
-
51
-
52
-
53
-
54
-
55
-
56
-
57
-
58
-
59
-
60
-
61
-
62
-
63
-
64
-
65
-
66
-
67
-
68
-
69
-
70
-
71
-
72
-
73
-
74
-
75
-
76
-
77
-
78
-
79
-
80
-
81
-
82
-
83
-
84
-
85
-
86
-
87
-
88
-
89
-
90
-
91
-
92
-
93
-
94
-
95
-
96
-
97
-
98
-
99
-
100
-
101
-
102
-
103
-
104
-
105
-
 106
106 -
 107
107 -
 108
108 -
 109
109 -
 110
110 -
 111
111 -
 112
112 -
 113
113 -
 114
114 -
 115
115 -
 116
116 -
 117
117 -
 118
118 -
 119
119 -
 120
120 -
 121
121 -
 122
122 -
 123
123 -
 124
124 -
 125
125 -
 126
126 -
127
-
128
-
129
-
130
-
131
-
132
-
133
-
134
-
135
-
136
-
137
-
138
-
139
-
140
-
141
-
142
-
143
-
144
-
145
-
146
-
147
-
148
-
149
-
150
-
151
-
152
-
153
-
154
-
155
-
156
-
157
-
158
-
159
-
160
-
161
-
162
-
163
-
164
-
165
-
166
-
167
-
168
-
169
-
170
-
171
-
172
-
173
-
174
-
175
-
176
-
177
-
178
-
179
-
180
-
181
-
182
-
183
-
184
-
185
-
186
-
187
-
188
-
189
-
190
-
191
-
192
-
193
-
194
-
195
-
196
-
197
-
198
-
199
-
200
-
201
-
202
-
203
-
204
-
205
-
206
-
207
-
208
-
209
-
210
-
211
-
212
-
213
-
214
-
215
-
216
-
217
-
218
-
219
-
220
-
221
-
222
-
223
-
224
-
225
-
226
-
227
-
228
-
229
-
230
-
231
-
232
-
233
-
234
-
235
-
236
-
237
-
238
-
239
-
240
-
241
-
242
-
243
-
244
-
245
-
246
-
247
 |
 |

114 Lenovo Group Limited 2015/16 Annual Report
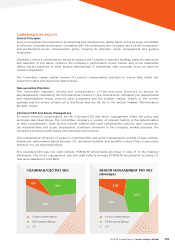
COMPENSATION COMMITTEE REPORT
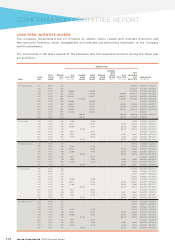
LONG-TERM INCENTIVE SCHEME
The Company implemented the LTI Program to attract, retain, reward and motivate Executive and
Non-executive Directors, senior management and selected top-performing employees of the Company
and its subsidiaries.
The movements in the share awards of the Executive and Non-executive Directors during the fiscal year
are as follows:
Number of units
Name
Award
type
Fiscal
Year of
Award
Effective
price
(HK$)
As at
April 1, 2015
(Unvested)
Awarded
during
the year
Vested
during
the year
Exercised
during
the year
Cancelled/
lapsed
during
the year
(Note 2)
As at
Mar 31, 2016
(unvested)
Total
outstanding
as at
Mar 31, 2016
Vesting period
(mm.dd.yyyy)
Mr. Yang Yuanqing SAR 09/10 5.23 – – – – – – 6,596,156 02.08.2011 – 02.08.2014
SAR 10/11 4.92 – – – – – – 11,030,219 02.21.2012 – 02.21.2015
SAR 11/12 6.80 2,783,088 –2,783,088 – – – 11,132,358 02.13.2013 – 02.13.2016
SAR 12/13 8.22 7,029,787 –3,514,893 – – 3,514,894 14,059,573 02.04.2014 – 02.04.2017
SAR 13/14 9.815 14,520,062 –3,630,017 – – 10,890,045 14,520,062 06.03.2015 – 06.03.2018
SAR 15/16 12.29 –12,703,664 – – – 12,703,664 12,703,664 06.01.2016 – 06.01.2019
RSU 11/12 6.80 1,669,853 –1,669,853 – – – – 02.13.2013 – 02.13.2016
RSU 12/13 8.22 2,849,913 –1,424,957 – – 1,424,956 1,424,956 02.04.2014 – 02.04.2017
RSU 12/13 7.82 2,144,219 –1,072,110 – – 1,072,109 1,072,109 06.03.2014 – 06.03.2016
RSU 13/14 9.815 5,329,589 –1,332,397 – – 3,997,192 3,997,192 06.03.2015 – 06.03.2018
RSU 13/14 9.815 1,423,663 –1,423,663 – – – – 06.03.2015
RSU 15/16 12.29 –4,882,018 –––4,882,018 4,882,018 06.01.2016 – 06.01.2019
RSU 15/16 12.29 –1,131,814 –––1,131,814 1,131,814 06.01.2016
Mr. Zhu Linan SAR 12/13 6.36 91,438 –91,438 – – – 91,438 07.03.2013 – 07.03.2015
SAR 13/14 7.88 242,723 –121,361 – – 121,362 242,723 08.16.2014 – 08.16.2016
SAR 14/15 11.48 275,884 –91,961 – – 183,923 275,884 08.15.2015 – 08.15.2017
SAR 14/15 7.49 –403,970 –––403,970 403,970 08.14.2016 – 08.14.2018
RSU 12/13 6.36 36,577 –36,577 – – – – 07.03.2013 – 07.03.2015
RSU 13/14 7.88 65,601 –32,800 – – 32,801 32,801 08.16.2014 – 08.16.2016
RSU 14/15 11.48 67,509 –22,503 – – 45,006 45,006 08.15.2015 – 08.15.2017
RSU 15/16 7.49 –103,497 –––103,497 103,497 08.14.2016 – 08.14.2018
Mr. Zhao John Huan SAR 11/12 5.78 – – – – – – 103,913 11.03.2012 – 11.03.2014
SAR 12/13 6.36 91,438 –91,438 – – – 274,316 07.03.2013 – 07.03.2015
SAR 13/14 7.88 242,723 –121,361 – – 121,362 364,084 08.16.2014 – 08.16.2016
SAR 14/15 11.48 275,884 –91,961 – – 183,923 275,884 08.15.2015 – 08.15.2017
SAR 14/15 7.49 –403,970 –––403,970 403,970 08.14.2016 – 08.14.2018
RSU 12/13 6.36 36,577 –36,577 – – – – 07.03.2013 – 07.03.2015
RSU 13/14 7.88 65,601 –32,800 – – 32,801 32,801 08.16.2014 – 08.16.2016
RSU 14/15 11.48 67,509 –22,503 – – 45,006 45,006 08.15.2015 – 08.15.2017
RSU 15/16 7.49 –103,497 –––103,497 103,497 08.14.2016 – 08.14.2018
Dr. Tian Suning SAR 09/10 3.88 – – – – – – 263,796 08.07.2010 – 08.07.2012
SAR 09/10 4.47 – – – – – – 38,163 11.30.2010 – 11.30.2012
SAR 10/11 4.59 – – – – – – 237,001 08.20.2011 – 08.20.2013
SAR 11/12 4.56 – – – – – – 323,000 08.19.2012 – 08.19.2014
SAR 12/13 6.36 91,438 –91,438 – – – 274,316 07.03.2013 – 07.03.2015
SAR 13/14 7.88 242,723 –121,361 – – 121,362 364,084 08.16.2014 – 08.16.2016
SAR 14/15 11.48 275,884 –91,961 – – 183,923 275,884 08.15.2015 – 08.15.2017
SAR 14/15 7.49 –403,970 –––403,970 403,970 08.14.2016 – 08.14.2018
RSU 12/13 6.36 36,577 –36,577 – – – – 07.03.2013 – 07.03.2015
RSU 13/14 7.88 65,601 –32,800 – – 32,801 32,801 08.16.2014 – 08.16.2016
RSU 14/15 11.48 67,509 –22,503 – – 45,006 45,006 08.15.2015 – 08.15.2017
RSU 15/16 7.49 –103,497 –––103,497 103,497 08.14.2016 – 08.14.2018
Mr. Nicholas C. Allen SAR 09/10 4.47 – – – – – – 107,343 11.30.2010 – 11.30.2012
SAR 10/11 4.59 – – – – – – 237,001 08.20.2011 – 08.20.2013
SAR 11/12 4.56 – – – – – – 323,000 08.19.2012 – 08.19.2014
SAR 12/13 6.36 91,438 –91,438 – – – 274,316 07.03.2013 – 07.03.2015
SAR 13/14 7.88 242,723 –121,361 – – 121,362 364,084 08.16.2014 – 08.16.2016
SAR 14/15 11.48 275,884 –91,961 – – 183,923 275,884 08.15.2015 – 08.15.2017
SAR 14/15 7.49 –403,970 – – – 403,970 403,970 08.14.2016 – 08.14.2018
RSU 12/13 6.36 36,577 –36,577 – – – – 07.03.2013 – 07.03.2015
RSU 13/14 7.88 65,601 –32,800 – – 32,801 32,801 08.16.2014 – 08.16.2016
RSU 14/15 11.48 67,509 –22,503 – – 45,006 45,006 08.15.2015 – 08.15.2017
RSU 15/16 7.49 –103,497 –––103,497 103,497 08.14.2016 – 08.14.2018