Lenovo 2008 Annual Report Download - page 24
Download and view the complete annual report
Please find page 24 of the 2008 Lenovo annual report below. You can navigate through the pages in the report by either clicking on the pages listed below, or by using the keyword search tool below to find specific information within the annual report.-
 1
1 -
2
-
3
-
4
-
5
-
6
-
7
-
8
-
9
-
10
-
11
-
12
-
13
-
 14
14 -
 15
15 -
 16
16 -
 17
17 -
 18
18 -
 19
19 -
 20
20 -
 21
21 -
 22
22 -
 23
23 -
 24
24 -
 25
25 -
 26
26 -
 27
27 -
 28
28 -
 29
29 -
 30
30 -
 31
31 -
 32
32 -
 33
33 -
 34
34 -
35
-
36
-
37
-
38
-
39
-
40
-
41
-
42
-
43
-
44
-
45
-
46
-
47
-
48
-
49
-
50
-
51
-
52
-
53
-
54
-
55
-
56
-
57
-
58
-
59
-
60
-
61
-
62
-
63
-
64
-
65
-
66
-
67
-
68
-
69
-
70
-
71
-
72
-
73
-
74
-
75
-
76
-
77
-
78
-
79
-
80
-
81
-
82
-
83
-
84
-
85
-
86
-
87
-
88
-
89
-
90
-
91
-
92
-
93
-
94
-
95
-
96
-
97
-
98
-
99
-
100
-
101
-
102
-
103
-
104
-
105
-
106
-
107
-
108
-
109
-
110
-
111
-
112
-
113
-
114
-
115
-
116
-
117
-
118
-
119
-
120
-
121
-
122
-
123
-
124
-
125
-
126
-
127
-
128
-
129
-
130
-
131
-
132
-
133
-
134
-
135
-
136
-
137
-
138
-
139
-
140
-
141
-
142
-
143
-
144
-
145
-
146
-
147
-
148
 |
 |

MANAGEMENT’S DISCUSSION & ANALYSIS
22 Lenovo Group Limited • Annual Report 2007/08
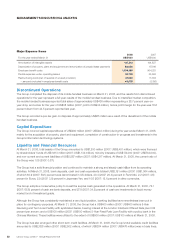
Major Expense Items
For the year ended March 31
2008
US$’000
2007
US$’000
Amortization of intangible assets 127,313 104,837
Depreciation of property, plant and equipment and amortization of prepaid lease payments 88,025 67,819
Employee benefit costs 1,194,196 904,251
Rental expenses under operating leases 34,703 33,393
Restructuring costs (net of reversal of unused provision) 47,640 11,794
– amounts included in employee benefit costs 44,070 (3,156)
Discontinued Operations
The Group completed the disposal of its mobile handset business on March 31, 2008, and the results from discontinued
operations for the year represent a full year results of the mobile handset business. Due to intensified market competition,
the mobile handset business reported total sales of approximately US$436 million representing a 28.7 percent year-on-
year drop, and a loss for the year of US$38 million (2007: profit of US$33 million). Gross profit margin for the year was 16.6
percent down from 24.5 percent reported last year.
The Group recorded a pre-tax gain on disposal of approximately US$65 million as a result of the divestment of the mobile
handset business.
Capital Expenditure
The Group incurred capital expenditures of US$290 million (2007: US$243 million) during the year ended March 31, 2008,
mainly for the acquisition of property, plant and equipment, completion of construction-in-progress and investments in the
Group’s information technology systems.
Liquidity and Financial Resources
At March 31, 2008, total assets of the Group amounted to US$7,200 million (2007: US$5,451 million), which were financed
by shareholders’ funds of US$1,613 million (2007: US$1,134 million), minority interests of US$174,000 (2007: US$744,000),
and non-current and current liabilities of US$5,587 million (2007: US$4,317 million). At March 31, 2008, the current ratio of
the Group was 1.05 (2007: 0.87).
The Group had a solid financial position and continued to maintain a strong and steady cash inow from its operating
activities. At March 31, 2008, bank deposits, cash and cash equivalents totaled US$2,191 million (2007: US$1,064 million),
of which 63.9 (2007: 59.1) percent was denominated in US dollars, 20.4 (2007: 20.3) percent in Renminbi, 2.2 (2007: 4.6)
percent in Euros, 2.9 (2007: 3.9) percent in Japanese Yen, and 10.6 (2007: 12.1) percent in other currencies.
The Group adopts a conservative policy to invest the surplus cash generated in the operations. At March 31, 2008, 72.1
(2007: 65.8) percent of cash are bank deposits, and 27.9 (2007: 34.2) percent of cash are investments in liquid money
market fund of investment grade.
Although the Group has consistently maintained a very liquid position, banking facilities have nevertheless been put in
place for contingency purposes. At March 31, 2008, the Group had a US$400 million (2007: US$400 million) 5-Year
Revolving and Term Loan Facility with syndicated banks, bearing interest at the London Interbank Offered Rate plus 0.52
percent per annum; and a US$100 million (2007: US$100 million) 5-Year Fixed Rate Loan Facility with a policy bank in the
Chinese Mainland. These facilities were utilized to the extent of US$500 million (2007: US$100 million) at March 31, 2008.
The Group has also arranged other short-term credit facilities. At March 31, 2008, the Group’s total available credit facilities
amounted to US$2,628 million (2007: US$2,502 million), of which US$384 million (2007: US$476 million) was in trade lines,