KeyBank 2009 Annual Report Download - page 6
Download and view the complete annual report
Please find page 6 of the 2009 KeyBank annual report below. You can navigate through the pages in the report by either clicking on the pages listed below, or by using the keyword search tool below to find specific information within the annual report.-
 1
1 -
 2
2 -
 3
3 -
 4
4 -
 5
5 -
 6
6 -
 7
7 -
 8
8 -
 9
9 -
 10
10 -
 11
11 -
 12
12 -
 13
13 -
 14
14 -
 15
15 -
 16
16 -
 17
17 -
18
-
19
-
20
-
21
-
22
-
23
-
24
-
25
-
26
-
27
-
28
-
29
-
30
-
31
-
32
-
33
-
34
-
35
-
36
-
37
-
38
-
39
-
40
-
41
-
42
-
43
-
44
-
45
-
46
-
47
-
48
-
49
-
50
-
51
-
52
-
53
-
54
-
55
-
56
-
57
-
58
-
59
-
60
-
61
-
62
-
63
-
64
-
65
-
66
-
67
-
68
-
69
-
70
-
71
-
72
-
73
-
74
-
75
-
76
-
77
-
78
-
79
-
80
-
81
-
82
-
83
-
84
-
85
-
86
-
87
-
88
-
89
-
90
-
91
-
92
-
93
-
94
-
95
-
96
-
97
-
98
-
99
-
100
-
101
-
102
-
103
-
104
-
105
-
106
-
107
-
108
-
109
-
110
-
111
-
112
-
113
-
114
-
115
-
116
-
117
-
118
-
119
-
120
-
121
-
122
-
123
-
124
-
125
-
126
-
127
-
128
-
129
-
130
-
131
-
132
-
133
-
134
-
135
-
136
-
137
-
138
 |
 |

4
Strong Capital, Reserves and Liquidity
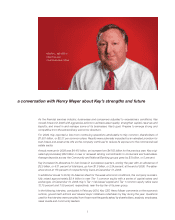
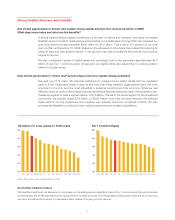
Key moved aggressively to bolster and sustain strong capital and loan loss reserve positions in 2009.
What steps were taken and what are the benefits?
A strong balance sheet inspires confidence on the part of clients and investors, and gives us needed
flexibility when it comes to making loans and investing in our businesses. During 2009, we increased our
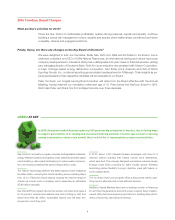
loan loss reserve by approximately $900 million to $2.5 billion. That’s about 4.3 percent of our total
loan portfolio at December 31, 2009. Based on the allowance to total loans, Key ranked third among its
peers at year-end (see graphic below). A strong loan loss reserve positions Key well as the economy
begins to improve.
We also completed a series of capital raises and exchanges that in total generated approximately $2.4
billion of new Tier 1 common equity. At year-end, our capital ratios also placed Key in a strong position
relative to its peer group.
How did the government’s “stress test” process figure into your capital-raising activities?
Key was one of 19 major U.S. financial institutions to undergo the so-called “stress test” by regulators
early in 2009. Regulators made it clear at that time that these selected organizations were the most
important in the U.S. and the most influential to systemic functioning of the economy. While we had
different views on some of the projections and hypothetical adverse scenarios used in the analysis, none-
theless we agreed to raise a capital cushion of $1.8 billion. Thanks to the active support of the investment
community, we actually raised $2.4 billion, or $600 million more than we were directed. We believed
these actions not only positioned us to weather very adverse economic conditions in 2009, but also
provided the flexibility to continue to lend, make investments and consider acquisitions.
FHN FITB KEY HBAN ZION RF MIPNCWFC STI USB BBT CMA MTB
0%
1%
2%
3%
4%
5%
Allowance for Loan Losses to Total Loans
FHN BBT CMA STI KEY MI RFFITBUSB ZIONHBANWFC PNC MTB
0%
2%
4%
6%
8%
10%
Tier 1 Common Equity
Key Fortifies Its Balance Sheet
With significant additions to its allowance for loan losses, and by adding approximately $2.4 billion in Tier 1 common equity through stock sales
and exchanges, Key fortified its balance sheet during 2009 for the weak economy. The strong balance sheet positions Key well for an improving
economy, and places the company in a favorable position relative to its peer group at year-end.
Source: SNL Financial. Data as of December 31, 2009.