KeyBank 2004 Annual Report Download - page 18
Download and view the complete annual report
Please find page 18 of the 2004 KeyBank annual report below. You can navigate through the pages in the report by either clicking on the pages listed below, or by using the keyword search tool below to find specific information within the annual report.-
 1
1 -
2
-
3
-
4
-
5
-
6
-
7
-
 8
8 -
 9
9 -
 10
10 -
 11
11 -
 12
12 -
 13
13 -
 14
14 -
 15
15 -
 16
16 -
 17
17 -
 18
18 -
 19
19 -
 20
20 -
 21
21 -
 22
22 -
 23
23 -
 24
24 -
 25
25 -
 26
26 -
 27
27 -
 28
28 -
29
-
30
-
31
-
32
-
33
-
34
-
35
-
36
-
37
-
38
-
39
-
40
-
41
-
42
-
43
-
44
-
45
-
46
-
47
-
48
-
49
-
50
-
51
-
52
-
53
-
54
-
55
-
56
-
57
-
58
-
59
-
60
-
61
-
62
-
63
-
64
-
65
-
66
-
67
-
68
-
69
-
70
-
71
-
72
-
73
-
74
-
75
-
76
-
77
-
78
-
79
-
80
-
81
-
82
-
83
-
84
-
85
-
86
-
87
-
88
-
89
-
90
-
91
-
92
 |
 |

16
MANAGEMENT’S DISCUSSION & ANALYSIS OF FINANCIAL CONDITION & RESULTS OF OPERATIONS KEYCORP AND SUBSIDIARIES
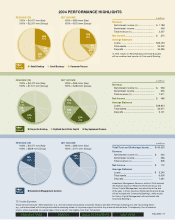
Consumer Banking
As shown in Figure 3, net income for Consumer Banking was $375
million for 2004, down from $412 million for 2003 and $445 million
for 2002. Two principal causes of the decline were the fourth quarter
2004 sale of the broker-originated home equity loan portfolio, and the
reclassification of the indirect automobile loan portfolio to held-for-sale
status. These actions resulted in significant decreases in noninterest
income and in the provision for loan losses, and a substantial increase
in noninterest expense. Excluding the effects of the above actions, net
income for Consumer Banking was $452 million for 2004.
Taxable-equivalent net interest income decreased by $34 million, or 2%,
from 2003, due to a less favorable interest rate spread on deposits. The
adverse effect of the lower deposit spread was partially offset by a
more favorable spread on average earning assets, a 9% increase in
average commercial loans and growth in average core deposits. Increased
deposits were primarily in the form of money market deposit accounts,
negotiable order of withdrawal (“NOW”) accounts and noninterest-
bearing deposits, reflecting client preferences for investments that
provide high levels of liquidity in a low interest rate environment.
Noninterest-bearing deposits also increased because we intensified our
cross-selling efforts, and focused sales and marketing efforts on our free
checking products.
Noninterest income decreased by $40 million, or 8%, due largely to a
$46 million loss recorded in connection with management’s decision to
sell the loan portfolios mentioned above and a $24 million reduction in
service charges on deposit accounts — primarily in Retail Banking. The
decrease in deposit service charges resulted from lower overdraft and
maintenance fees. These adverse changes were offset in part by a $32
million decrease in net losses incurred on the residual values of leased
vehicles in the Indirect Lending unit and a $6 million increase in income
from electronic banking activities.
The provision for loan losses decreased by $114 million, or 41%,
because of improved asset quality in each of the major lines of businesses
and a $21 million credit to the provision recorded in the fourth quarter
of 2004. The credit resulted from the reversal of provision recorded in
prior periods and was taken in connection with management’s decision
to sell the indirect automobile loan portfolio.
Noninterest expense rose by $68 million, or 5%, from 2003, due
largely to a $55 million write-off of goodwill recorded in connection with
management’s decision to sell Key’s nonprime indirect automobile loan
business and a $17 million rise in personnel expense.
During the second half of 2004, we improved our market share position
by acquiring EverTrust, headquartered in Everett, Washington with
assets of approximately $780 million and deposits of approximately
$570 million at the date of acquisition. We also acquired ten branch
offices and approximately $380 million of deposits of Sterling Bank &
Trust FSB in suburban Detroit, Michigan.
In 2003, the decrease in net income was attributable to a $19 million,
or 1%, reduction in taxable-equivalent net interest income, a $10
million, or 2%, reduction in noninterest income and a $43 million, or
3%, increase in noninterest expense. The adverse effects of these
changes were partially offset by a $20 million, or 7%, decrease in the
provision for loan losses, due to improved asset quality in the Indirect
Lending unit and the Retail Banking line of business.
NEXT PAGEPREVIOUS PAGE SEARCH BACK TO CONTENTS
Year ended December 31, Change 2004 vs 2003
dollars in millions 2004 2003 2002 Amount Percent
REVENUE (TAXABLE EQUIVALENT)
Consumer Banking $2,257 $2,331 $2,360 $(74) (3.2)%
Corporate and Investment Banking 1,511 1,467 1,486 44 3.0
Investment Management Services 808 783 822 25 3.2
Other Segments 15 56 2 (41) (73.2)
Total segments 4,591 4,637 4,670 (46) (1.0)
Reconciling Items (114) (81) (32) (33) (40.7)
Total $4,477 $4,556 $4,638 $(79) (1.7)%
NET INCOME (LOSS)
Consumer Banking $ 375 $412 $445 $ (37) (9.0)%
Corporate and Investment Banking 486 358 369 128 35.8
Investment Management Services 112 81 96 31 38.3
Other Segments 31 56 26 (25) (44.6)
Total segments 1,004 907 936 97 10.7
Reconciling Items (50) (4) 40 (46) N/M
Total $ 954 $903 $976 $ 51 5.6%
N/M = Not Meaningful
FIGURE 2. MAJOR BUSINESS GROUPS — TAXABLE-EQUIVALENT REVENUE AND NET INCOME