Kenwood 2005 Annual Report Download - page 7
Download and view the complete annual report
Please find page 7 of the 2005 Kenwood annual report below. You can navigate through the pages in the report by either clicking on the pages listed below, or by using the keyword search tool below to find specific information within the annual report.-
 1
1 -
 2
2 -
 3
3 -
 4
4 -
 5
5 -
 6
6 -
 7
7 -
 8
8 -
 9
9 -
 10
10 -
 11
11 -
 12
12 -
 13
13 -
 14
14 -
 15
15 -
 16
16 -
 17
17 -
 18
18 -
19
-
20
-
21
-
22
-
23
-
24
 |
 |

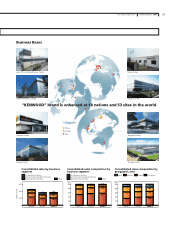
Offices
Factories
Sales
“KENWOOD” brand is enhanced at 18 nations and 53 sites in the world
Head Office / Hachioji Business Center France Factory
Yokohama Business Center Malaysia Factory
Yamagata Factory Singapore Factory
Nagano Factory Shanghai Factory
Business Bases
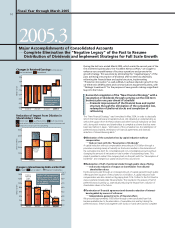
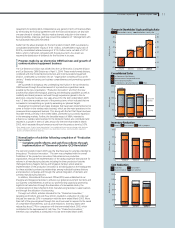
Consolidated sales composition by
geographic area
100
0
20
40
60
80
Consolidated sales by business
segment
300
0
100
200
57.8
30.4
10.4
1.3
51.9 56.4
27.0 28.2
18.6 13.4
2.5 2.0
2003/3
100.8
50.4
24.0
3.6
117.0
61.0
41.9
5.7
2002/3 2004/3
2.4
104.8
55.1
18.9
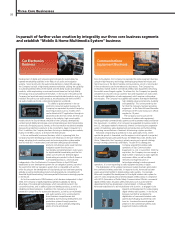
Communications Equipment Business
Home Electronics Business
Car Electronics Business Japan Americas Europe Asia, others
2003/32002/3 2004/3
100
0
20
40
60
80
39.8
26.0
20.8
13.4
33.1
31.4
23.6
11.9
38.9
26.7
22.6
11.8
2003/32002/3 2004/3
Others
Consolidated sales composition by
business segment
Communications Equipment Business
Home Electronics Business
Car Electronics Business
Others
Billions of yen
07
Kenwood Corporation Annual Report 2005