Kenwood 2004 Annual Report Download - page 15
Download and view the complete annual report
Please find page 15 of the 2004 Kenwood annual report below. You can navigate through the pages in the report by either clicking on the pages listed below, or by using the keyword search tool below to find specific information within the annual report.-
 1
1 -
2
-
3
-
4
-
 5
5 -
 6
6 -
 7
7 -
 8
8 -
 9
9 -
 10
10 -
 11
11 -
 12
12 -
 13
13 -
 14
14 -
 15
15 -
 16
16 -
 17
17 -
 18
18 -
 19
19 -
 20
20 -
 21
21 -
 22
22 -
 23
23 -
 24
24 -
 25
25 -
26
-
27
-
28
-
29
-
30
-
31
-
32
-
33
-
34
-
35
-
36
-
37
-
38
-
39
-
40
-
41
-
42
-
43
-
44
 |
 |

Cost-to-sales ratio
Transition of accumulated losses and interest bearing debt
Accumulated Losses Net debt Cash / Deposits
(Billions of yen)
120
-40
40
20
60
80
100
2003/32002/3 2004/3
-38.6 -34.2
-9.8
85.9
50.1
29.9
24.2
30.8
37.4
110.1
80.9
67.3
0
-20
Transition of fixed cost composition
Fixed cost
(Billions of yen) (%)
100
0
20
40
60
80
2003/32002/3 2004/3
97.3
85.6
64.9
11.7
20.7
80
66
72
70
68
74
76
78
Change of cost and expenses composition
Cost of goods Selling, general and administrative expenses
Operation income
(Billions of yen) (%)
350
0
150
100
50
200
250
300
2003/32002/3 2004/3
231.5
162.4
126.4
65.0
50.9
39.7
6.1
12.3
12.6
Operating income ratio
10
0
2
4
6
8
2.0%
5.4%
7.1%
76.5%
72.0%
70.7%
Transition of shareholders' equity
Shareholders' equity Shareholders' equity ratio
(Billions of yen) (%)
200
-50
0
50
100
150
30
-20
-10
0
10
20
2003/32002/3 2004/3
-17.0
-9.3% 13.7 20.2
182.9
135.8
142.1
9.6% 14.9%
organizational reforms and various measures for affiliated firms to enhance
competitiveness and ability to respond to market change. In view of making the
use of resources on a consolidated basis more efficient, improving SCM and
increasing CS, the Company further accelerated the reorganization of domestic
affiliates, merging Kenwood Service Corporation, an after-sales service
subsidiary, and Kenwood Logistics Corporation, a distribution unit, in January
2004.
Financial restructuring
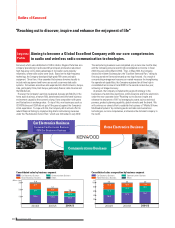
Cash flows from operating activities increased about 17.1 billion yen, or some
170%, from a year earlier, to 27.502 billion yen, due mainly to a reduction in
inventories through production innovations, increased net income and contraction
in accounts receivable thanks to the reforms in marketing structure that started
during the previous year.
Consolidated interest-bearing debts fell around 13.6 billion yen to 67.272 billion
yen, owing to an active repayment of borrowings supported by strong cash flows,
and net debts were 29.885 billion yen, achieving the initial target of 30.0 billion
yen or less.
Loss carried forward decreased about 24.5 billion yen to 9.777 billion yen, due
to the disposition of additional paid-in capital that was enhanced with increase
of capital through a third-party allocation of new shares and a debt-for-equity
swap in the previous year, as well as a record net income for the second straight
year. Shareholders' equity increased some 6.5 billion yen year-on-year to 20.161
billion yen, and the equity ratio gained 5.3 percentage points to 14.9%, by the
end of the fiscal year.
Kenwood Corporation 15