Kenwood 2002 Annual Report Download - page 3
Download and view the complete annual report
Please find page 3 of the 2002 Kenwood annual report below. You can navigate through the pages in the report by either clicking on the pages listed below, or by using the keyword search tool below to find specific information within the annual report.-
 1
1 -
 2
2 -
 3
3 -
 4
4 -
 5
5 -
 6
6 -
 7
7 -
 8
8 -
 9
9 -
 10
10 -
 11
11 -
 12
12 -
 13
13 -
 14
14 -
15
-
16
-
17
-
18
-
19
-
20
-
21
-
22
-
23
-
24
-
25
-
26
-
27
-
28
-
29
-
30
-
31
-
32
-
33
-
34
-
35
-
36
 |
 |

KENWOOD Corporation Annual Report 2002 01
For the year:
Net sales
Net income (loss)
Per share data (in yen and U.S. dollars):
Net income (loss)
Cash dividends applicable to the year
At year-end:
Total assets
Total shareholders' equity
Millions of yen
Thousands of
U.S. dollars
Kenwood Corporation and Consolidated Subsidiaries
For the years ended March 31, 2002 and 2001
The U.S. dollar amounts in this report are provided for convenience only and have been converted at the rate of ¥133 to $1, the approximate rate of exchange in
effect at March 31, 2002.
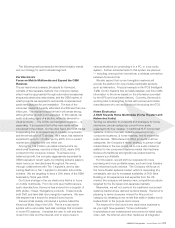
Financial Highlights
Net Sales
(Billions of yen)
0 100 200 300
Net Income (Loss)
(Billions of yen)
2002
2001
2000
1999
1998
(4)(27) 4(2) 0 2
Net Income (Loss) per Share
(Yen)
2002
2001
2000
1999
1998
(20)(160) 20(10) 0 10 30
2002
2001
2000
1999
1998