Kenwood 2001 Annual Report Download - page 17
Download and view the complete annual report
Please find page 17 of the 2001 Kenwood annual report below. You can navigate through the pages in the report by either clicking on the pages listed below, or by using the keyword search tool below to find specific information within the annual report.-
 1
1 -
2
-
3
-
4
-
5
-
6
-
 7
7 -
 8
8 -
 9
9 -
 10
10 -
 11
11 -
 12
12 -
 13
13 -
 14
14 -
 15
15 -
 16
16 -
 17
17 -
 18
18 -
 19
19 -
 20
20 -
 21
21 -
 22
22 -
 23
23 -
 24
24 -
 25
25 -
 26
26 -
 27
27 -
28
-
29
-
30
-
31
-
32
 |
 |

KENWOOD Corporation Annual Report 2001 15
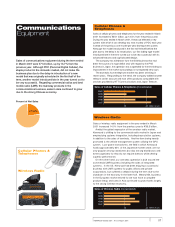
Total Shareholder's Equity
(Billions of yen)
1997
1998
1999
2000
0105202515 30
2001
Total Assets
(Billions of yen)
0 100 15050 200
1997
1998
1999
2000
2001
1997
1998
1999
2000
2001
(%)
0 5 10 15 20
Equity Ratio
billion the previous year) after tax.
Loss per share was 148.26 (a 6.91 net loss per
share for the previous year).
As of March 31, 2001, total assets of the Kenwood
Group amounted to 208.4 billion (down 1.9% from
the previous year). Current assets increased to 148.2
billion (an increase of 13.8%) mainly due to the
increased trade notes and accounts receivable for the
domestic market. Sales of production equipment led
to a 6.6% decrease in fixed assets at 33.7 billion and
investments and other assets decreased 42.6% to
26.5 billion from sales of investment securities,
expending the deferred tax asset, and the exclusion of
translation adjustments based on the new accounting
rule.
Current liabilities amounted to 163.7 billion (up
20.5% from the previous year). Increased short-term
borrowings and trade notes and accounts payable led
to the increase. Long-term liabilities rose 4.9% from
the previous year to 42.8 billion due to reinforcement
of employees' retirement benefits.
Cash and cash equivalents outstanding at the end of
the term under review were 20.9 billion, an increase of
2.4 billion from the previous year (18.5 billion).
Cash flows from operating activities decreased
24.2 billion from the previous year and the company
lost 7.4 billion. The 18.0 billion loss before tax (a
decrease of 16.8 billion) owing to the deteriorating
profit margin in the home and car audio businesses
was the major reason. Despite gaining some
proceeds from decrease of time deposits and sales of
investment securities, net cash used in investing
activities was 4.8 billion (decrease of 4.4 billion from
the previous year), as the company spent 13.1 billion
in acquiring property and software. Net cash provided
by financing activities was 12.7 billion, of which 5.0
billion was gained by issuing corporate bonds and
8.0 billion by added long-term and short-term
borrowings.
Total capital expenditure during the term was 13.8
billion, an increase of 25.9% from the previous year.
The majority was spent in purchases of tools and dies
for new products.
The deficit in working capital at the end of the financial
year was 15.5 billion. The current ratio was 0.91
(0.96 for the previous year). The shareholders' equity
ratio was 0.7% (16.6% for the previous year) and the
asset turnover rate was 1.46 times (1.29 for the
previous year).
Financial Position
Cash Flows
Financial Indicators
Capital Expenditures