Jack In The Box 2006 Annual Report Download - page 5
Download and view the complete annual report
Please find page 5 of the 2006 Jack In The Box annual report below. You can navigate through the pages in the report by either clicking on the pages listed below, or by using the keyword search tool below to find specific information within the annual report.-
 1
1 -
 2
2 -
 3
3 -
 4
4 -
 5
5 -
 6
6 -
 7
7 -
 8
8 -
 9
9 -
 10
10 -
 11
11 -
 12
12 -
 13
13 -
 14
14 -
 15
15 -
 16
16 -
17
-
18
-
19
-
20
-
21
-
22
-
23
-
24
-
25
-
26
-
27
-
28
-
29
-
30
-
31
-
32
-
33
-
34
-
35
-
36
-
37
-
38
-
39
-
40
-
41
-
42
-
43
-
44
-
45
-
46
-
47
-
48
-
49
-
50
-
51
-
52
-
53
-
54
-
55
-
56
-
57
-
58
-
59
-
60
-
61
-
62
-
63
-
64
-
65
-
66
-
67
-
68
-
69
-
70
-
71
-
72
-
73
-
74
-
75
-
76
-
77
-
78
-
79
-
80
-
81
-
82
-
83
-
84
-
85
-
86
-
87
-
88
 |
 |

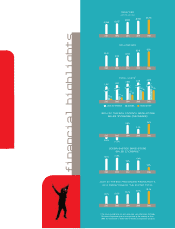
financial highlights
(0.8)% (1.7)%
4.6%
2.4%
4.8%
TOTAL UNITS1
1,862 1,947 2,006 2,049
18
29
44
JACK IN THE BOX QDOBA QUICK STUFF
12
250
2,079
55
318
177
111
79
$2.00
$1.90
$2.02
$2.48 $3.01
$1,966 $2,057 $2,320 $2,504 $2,766
13.1% 14.5%
9.6%
11.4%
5.9%
JACK IN THE BOX FRANCHISED RESTAURANTS,
AS A PERCENTAGE OF THE SYSTEM TOTAL
19.1% 20.2% 22.3% 25.1% 29.1%
2002 2003 2004 2005 2006
QDOBA SYSTEM SAME-STORE
SALES INCREASE1
2002 2003 2004 2005 2006
JACK IN THE BOX COMPANY SAME-STORE
SALES INCREASE (DECREASE)
2002 2003 2004 2005 2006
2002 2003 2004 2005 2006
DILUTED EPS
2002 2003 2004 2005 2006
REVENUES
(IN MILLIONS)
2002 2003 2004 2005 2006
1The charts include total unit and same-store sales information for Qdoba
Restaurant Corporation prior to its acquisition by the company in fiscal
2003. This information is shown only for historical comparative purposes.
1