JCPenney 2015 Annual Report Download - page 23
Download and view the complete annual report
Please find page 23 of the 2015 JCPenney annual report below. You can navigate through the pages in the report by either clicking on the pages listed below, or by using the keyword search tool below to find specific information within the annual report.-
 1
1 -
2
-
3
-
4
-
5
-
6
-
7
-
8
-
9
-
10
-
11
-
12
-
 13
13 -
 14
14 -
 15
15 -
 16
16 -
 17
17 -
 18
18 -
 19
19 -
 20
20 -
 21
21 -
 22
22 -
 23
23 -
 24
24 -
 25
25 -
 26
26 -
 27
27 -
 28
28 -
 29
29 -
 30
30 -
 31
31 -
 32
32 -
 33
33 -
34
-
35
-
36
-
37
-
38
-
39
-
40
-
41
-
42
-
43
-
44
-
45
-
46
-
47
-
48
-
49
-
50
-
51
-
52
-
53
-
54
-
55
-
56
-
57
-
58
-
59
-
60
-
61
-
62
-
63
-
64
-
65
-
66
-
67
-
68
-
69
-
70
-
71
-
72
-
73
-
74
-
75
-
76
-
77
-
78
-
79
-
80
-
81
-
82
-
83
-
84
-
85
-
86
-
87
-
88
-
89
-
90
-
91
-
92
-
93
-
94
-
95
-
96
-
97
-
98
-
99
-
100
-
101
-
102
-
103
-
104
-
105
-
106
-
107
-
108
-
109
-
110
-
111
-
112
-
113
-
114
-
115
-
116
-
117
-
118
-
119
-
120
-
121
-
122
-
123
-
124
-
125
-
126
-
127
-
128
-
129
-
130
-
131
-
132
-
133
-
134
-
135
-
136
-
137
-
138
-
139
-
140
-
141
-
142
-
143
-
144
-
145
-
146
-
147
-
148
-
149
-
150
-
151
-
152
-
153
-
154
-
155
-
156
-
157
-
158
-
159
-
160
-
161
-
162
-
163
-
164
-
165
-
166
-
167
-
168
-
169
-
170
-
171
-
172
-
173
-
174
-
175
-
176
-
177
 |
 |

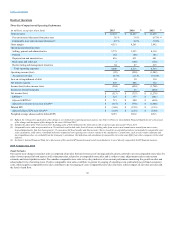
Table of Contents
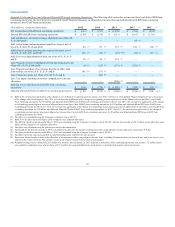
(1) (1) (1) (1)
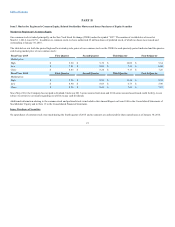
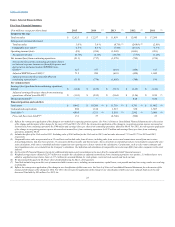
Total net sales $ 12,625
$ 12,257
$ 11,859
$ 12,985
$ 17,260
Sales percent increase/(decrease):
Total net sales 3.0 %
3.4 %
(8.7)% (2) (24.8)% (2) (2.8)%
Comparable store sales(3) 4.5 %
4.4 %
(7.4)%
(25.1)%
0.3 %
Operating income/(loss) (89)
(254)
(1,242)
(1,001)
(201)
As a percent of sales (0.7)%
(2.1)%
(10.5)%
(7.7)%
(1.2)%
Net income/(loss) from continuing operations (513)
(717)
(1,278)
(795)
(274)
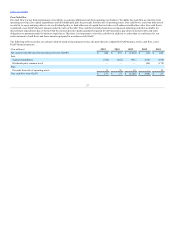
527
377
(641)
(458)
317
715
280
(610)
(420)
1,042
(315)
(778)
(1,405)
(780)
199
Earnings/(loss) per share from continuing operations,
diluted $ (1.68)
$ (2.35)
$ (5.13)
$ (3.63)
$ (1.26)
(4) $ (1.03)
$ (2.55)
$ (5.64)
$ (3.56)
$ 0.90 (5)
Dividends declared(6) —
—
—
0.20
0.80
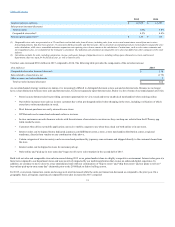
Total assets $ 9,442
$ 10,309 (8) $ 11,710 (8) $ 9,761 (8) $ 11,402 (8)
Cash and cash equivalents 900
1,318
1,515
930
1,507
Total debt (7) 4,805
5,321 (8) 5,510 (8) 2,962 (8) 3,080 (8)
(4) 131
57
(2,746)
(906)
23
23