Isuzu 2006 Annual Report Download - page 8
Download and view the complete annual report
Please find page 8 of the 2006 Isuzu annual report below. You can navigate through the pages in the report by either clicking on the pages listed below, or by using the keyword search tool below to find specific information within the annual report.-
 1
1 -
 2
2 -
 3
3 -
 4
4 -
 5
5 -
 6
6 -
 7
7 -
 8
8 -
 9
9 -
 10
10 -
 11
11 -
 12
12 -
 13
13 -
 14
14 -
 15
15 -
 16
16 -
 17
17 -
 18
18 -
 19
19 -
20
-
21
-
22
-
23
-
24
-
25
-
26
-
27
-
28
-
29
-
30
-
31
-
32
-
33
-
34
-
35
-
36
-
37
-
38
-
39
-
40
-
41
-
42
-
43
-
44
-
45
-
46
 |
 |

6
Isuzu Motors Limited Annual Report 2006
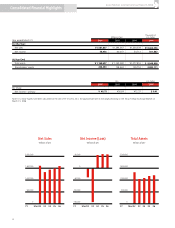
Segment Information
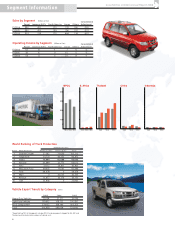
World Ranking of Truck Production
2004 Production
Rank Manufacturer Medium-duty Heavy-duty Total
1 DaimlerChrysler 27,582 75,630 103,212
2 Freightliner 34,720 60,152 94,872
3 Isuzu 75,944 16,088 92,032
4 Navistar 43,899 22,773 66,672
5 Hino 41,112 24,811 65,923
6 Mitsubishi Fuso 49,455 11,041 60,496
7 Ford 48,678 0 48,678
8 Man 0 42,533 42,533
9 Renault 13,877 26,276 40,153
10 GM 35,945 0 35,945
Sales by Segment
Parent Japanese DLR’s North America Asean Others Adjustment
FY2004 890 471 235 233 186 -585
FY2005 880 475 199 296 197 -553
FY2006 918 519 170 444 214 -683
Vehicle Export Trends by Category
2003 2004 2005
Heavy-Duty Vehicles 22,054 21,217 19,786
Light-Duty Vehicles 109,652 108,732 100,891
KD & Component* 279,132 358,190 401,253
Total 410,838 488,139 521,930
*Export data of KD & Component includes RV KD and component shipped to SIA, IBC and
Thailand and translated into numbers of vehicle units.
(Billions of Yen)
(Units)
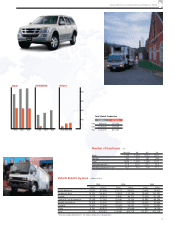
’04/3 ’05/3 ’06/3
China
’04/3 ’05/3 ’06/3
Indonesia
’04/3 ’05/3 ’06/3
Thailand
’04/3 ’05/3 ’06/3
S. AfricaISPOL
100
200
300
400
’04/3 ’05/3 ’06/3
Consolidated
Operating Income by Segment
Parent Japanese DLR’s North America Asean Others Adjustment
FY2004 67 8 -1 7 6 -2
FY2005 61 6 0 15 5 0
FY2006 54 4 5 21 8 -1
(Billions of Yen) Consolidated