Invacare 2005 Annual Report Download - page 9
Download and view the complete annual report
Please find page 9 of the 2005 Invacare annual report below. You can navigate through the pages in the report by either clicking on the pages listed below, or by using the keyword search tool below to find specific information within the annual report.-
 1
1 -
 2
2 -
 3
3 -
 4
4 -
 5
5 -
 6
6 -
 7
7 -
 8
8 -
 9
9 -
 10
10 -
 11
11
 |
 |

1415
Alsocontributingtotheoperatingearningsdecline
werehigherselling,generalandadministrative
(SG&A)expenseandhigherinterestexpense,
partiallyoffsetbyareducedeffectivetaxrate.
Thehigherinterestexpenserelatedtoacquisitions
andanincreasinginterestrateenvironment.Cost
reductionactionsbeginninginmid-2005began
tooffsetpricingpressuresandledtosequential
declinesinSG&Aexpenseduringthesecond
halfoftheyear.
StrongFinancialCondition
Withitscurrentcapitalizationstructure,the
Companyhastheflexibilitytocontinuetosupport
itscorebusinessesandmakeacquisitions.Inearly
2005,theCompanyrenegotiateditsrevolving
creditfacilitywithimprovedpricingandavailabil-
ity.InSeptember2005,Invacarereceived$75.5
millionundera364-day,$100millionaccounts
receivablesecuritizationfacility,whichwas
usedtoincreaseavailabledebtcapacityby
reducingbalancesoutstandingonitsrevolving
creditfacility.
Totaldebtoutstandingattheendoftheyearwas
$538million,resultinginadebt-to-total-capital-
izationof41.7%versus42.2%attheendoflast
year.TheCompanygenerated$51millionoffree
cashflowfortheyear.Invacareused$58million
incashtoacquirethreesmallcompaniesduring
theyear.Freecashflowisdefinedasnetcash
providedbyoperatingactivitieslesspurchases
ofpropertyandequipmentnetofproceedsfrom
salesofpropertyandequipment.(SeeInvacare’s
Form10-K.)
ReimbursementIssues
UncertaintycontinuesrelatedtoMedicare’s
reimbursementpoliciesforHME.TheCenters
forMedicareandMedicaidServicesarecurrently
scheduledtoissueanewruleonface-to-face
examsanddocumentationrequirementsfor
powerwheelchairsandothermobilitydevices
byApril1,2006,alongwithnewreimbursement
codes,possiblylaterintheyear.
Additionally,CongressrecentlypassedtheDeficit
ReductionAct,whichincludespaymentcutsto
homeoxygenthatwilltakeeffectinJanuary2009,
aswellasreductionsforcertaindurableHME
spendingthatwilltakeeffectin2007.President
Bush’sjust-releasedfiscalyear2007budget
proposalincludesfurther,potentiallysignificant,
paymentreductionsforhomeoxygentherapy.
Homeoxygentherapyisthemostcost-effective
andclinicallyefficacioustreatmentavailableto
thosewithchronicobstructivepulmonarydisease
(COPD)andlowbloodoxygen.Thisproposal
tocutMedicarepaymentsforhomeoxygen
woulddramaticallyerodethequalityofcarefor
beneficiariesandleadtoincreasedhospitaliza-
tion.In2002(themostrecentyearforwhichdata
isavailable),673,000peoplewerehospitalized
forCOPDatanaveragecosttoMedicarefortheir
stayofover$18,000.Homeoxygen,incontrast,
canbeprovidedtoapatientforoneyearatless
thantheaveragecostofonedayinthehospital.
InvacareandmembersoftheOhiocongressional
delegationhavebeenextremelyactiveinlobby-
ingagainstthesecutsandinfavorofthe
HMEindustry.
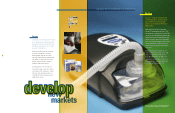
GrowthStrategy
Invacare’sgrowthplanhasthreeparts:to
leverageglobalmanufacturinganddistribution
capabilitiestolowercostsandcombatreimburse-
mentpressures;togrowthroughacquisitions;and
tocontinuetopursuekeymarketopportunities,
themostattractiveofwhicharehomeoxygen,
sleeptherapyandbariatrics.
HomeOxygen:BecauseInvacare’sHomeFillII
systemvirtuallyeliminatesthecostsofdelivering
oxygen,itistheidealsolutiontocutsinMedicare
reimbursement.TheHomeFillIIsystemisbeing
embracedbyindustryentrepreneurswhoare
buildingtheirbusinessesarounditandgaining
marketshare.Evenwiththegrowthtodate,sub-
stantialupsideexists.Only65,000ofthe800,000
ambulatoryoxygenpatientsintheU.S.areonthe
HomeFillIItoday,andoverseasmarketsarevirtu-
allyuntapped.Invacarehasprogramsunderway
toexpanditsHomeFillIIbusinessinEuropeand
todevelophomeoxygenproductsspecificallyfor
ChinaandJapan.
SleepTherapy:Invacarecurrentlyholdsonlya
smallpositionintherapidlygrowingsleepapnea
market,buttheCompanyhasbeeninvesting
consistentlyinproductdevelopmentandclinical
research.Designimprovementsintroducedinlate
2005makethePolaris™EX™ContinuousPositive
AirPressure(CPAP)systemeasierforpatientsto
use,andseveralexcitingnewsleepproductsare
indevelopment.Inaddition,anewlycompleted
clinicalstudyshowsasubstantialimprovement
incompliancewhenpatientsuseInvacare’sCPAP
withSoftX™Technology.
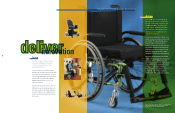
Bariatrics:Withtheobesityepidemicshowing
nosignofslowing,thebariatricmarketrepresents
anothersignificantmarketopportunity.Invacare
hasdevelopedanentirelineofbariatrichome
medicalproducts,withweightcapacitiesupto
1,000pounds.TheCompanyalsohostsabariatric
websitethatprovidesinformationandresources
forproviders,medicalprofessionalsandconsumers.
Outlookfor2006
Theongoingcost-cuttinginitiativescombined
withanoutstandingproductlineupareexpected
toresultinearningspershareofbetween$2.00
and$2.10in2006onanetsalesincreaseof4%
to6%.Thosesalesareexpectedtogeneratefree
cashflowofbetween$70millionand$80million.
Theearningsprojectionexcludestheimpactof
anynewacquisitionsbutincludestheimpactfrom
thestockoptionaccountingstandardSFAS123R.
Netsalesareexpectedtobeminimallyimpacted
byforeigncurrencyandthefull-yearinclusionof
2005acquisitions.
Afterseveralyearsofsolidgrowthinsalesand
earningspershare,itwasadifficult,though
necessary,decisiontorestructureandreposi-
tionthebusiness.Weregrettheimpactofthese
actionsontheaffectedassociates,theirfamilies
andthecommunities.Weareconfidentthat
thesechanges,combinedwithInvacare’sinherent
strengths,positiontheCompanyforrenewed
growththatwillprovideopportunitiesforas-
sociates,benefitstocustomersandconsumers,
andprofitablereturnstoshareholders.Wethank
Invacare’scustomers,associatesandsharehold-
ersfortheirsupport.
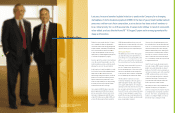
Sincerely,
A.MalachiMixon,III
ChairmanandChiefExecutiveOfficer
GeraldB.Blouch
PresidentandChiefOperatingOfficer
March13,2006
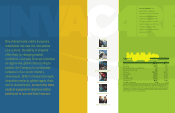
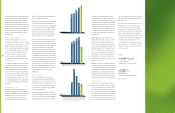
free
cash flow (in millions)
net
earnings (in millions)
net sales (in millions)
’01
$1,053.6
$1,089.2
$1,247.2
$1,403.3
$1,529.7
’02 ’03 ’04 ’05
’01
$60.4
$64.8
$71.4
$75.2
$48.9
’02 ’03 ’04 ’05
’01
$60.7
$115.9
$86.1
$56.9
$50.8
’02 ’03 ’04 ’05
free
cash flow (in millions)
net
earnings (in millions)
net sales (in millions)
’01
$1,053.6
$1,089.2
$1,247.2
$1,403.3
$1,529.7
’02 ’03 ’04 ’05
’01
$60.4
$64.8
$71.4
$75.2
$48.9
’02 ’03 ’04 ’05
’01
$60.7
$115.9
$86.1
$56.9
$50.8
’02 ’03 ’04 ’05
free
cash flow (in millions)
net
earnings (in millions)
net sales (in millions)
’01
$1,053.6
$1,089.2
$1,247.2
$1,403.3
$1,529.7
’02 ’03 ’04 ’05
’01
$60.4
$64.8
$71.4
$75.2
$48.9
’02 ’03 ’04 ’05
’01
$60.7
$115.9
$86.1
$56.9
$50.8
’02 ’03 ’04 ’05
Excludesnonrecurringandunusualamountof$25.2millionaftertax
in2001.
FreeCashFlowisdefinedasnetcashprovidedbyoperatingactivities
lesspurchasesofpropertyandequipmentnetofproceedsfromsales
ofpropertyandequipment.The2001freecashflowamountexcludes
nonrecurringandunusualamountof$29.9million.