Intel 1995 Annual Report Download - page 18
Download and view the complete annual report
Please find page 18 of the 1995 Intel annual report below. You can navigate through the pages in the report by either clicking on the pages listed below, or by using the keyword search tool below to find specific information within the annual report.-
 1
1 -
2
-
3
-
4
-
5
-
6
-
7
-
 8
8 -
 9
9 -
 10
10 -
 11
11 -
 12
12 -
 13
13 -
 14
14 -
 15
15 -
 16
16 -
 17
17 -
 18
18 -
 19
19 -
 20
20 -
 21
21 -
 22
22 -
 23
23 -
 24
24 -
 25
25 -
 26
26 -
 27
27 -
 28
28 -
29
-
30
-
31
-
32
-
33
-
34
-
35
-
36
-
37
-
38
-
39
-
40
-
41
 |
 |
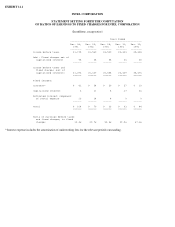
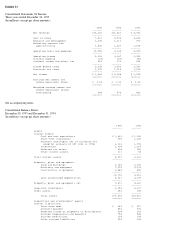
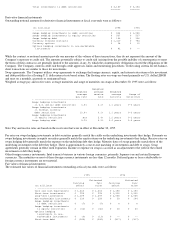
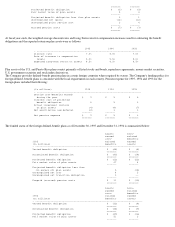
See accompanying notes.
Income taxes payable 801 429
------- -------
Total current liabilities 3,619 3,024
------- -------
Long-term debt 400 392
Deferred tax liabilities 620 389
Put warrants 725 744
Commitments and contingencies
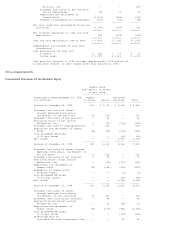
Stockholders' equity:
Preferred Stock, $.001 par value, 50 shares
authorized; none issued -- --
Common Stock, $.001 par value, 1,400 shares
authorized; 821 issued and outstanding in
1995 (827 in 1994) and capital in excess
of par value 2,583 2,306
Retained earnings 9,557 6,961
------- -------
Total stockholders' equity 12,140 9,267
------- -------
Total liabilities and stockholders' equity $17,504 $13,816
======= =======
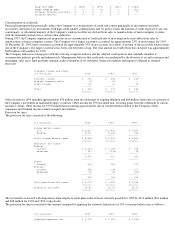
Consolidated Statements Of Cash Flows
Three years ended December 30, 1995
(In millions) 1995 1994 1993
------- ------- -------
Cash and cash equivalents,
beginning of year $ 1,180 $ 1,659 $ 1,843
======= ======= =======
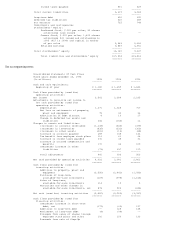
Cash flows provided by (used for)
operating activities:
Net income 3,566 2,288 2,295
Adjustments to reconcile net income to
net cash provided by (used for)
operating activities:
Depreciation 1,371 1,028 717
Net loss on retirements of property,
plant and equipment 75 42 36
Amortization of debt discount 8 19 17
Change in deferred tax assets and
liabilities 346 (150) 12
Changes in assets and liabilities:
(Increase) in accounts receivable (1,138) (530) (379)
(Increase) in inventories (835) (331) (303)
(Increase) in other assets (241) (13) (68)
Increase in accounts payable 289 148 146
Tax benefit from employee stock plans 116 61 68
Increase in income taxes payable 372 38 32
Increase in accrued compensation and
benefits 170 44 109
(Decrease) increase in other
liabilities (73) 337 119
------- ------- -------
Total adjustments 460 693 506
------- ------- -------
Net cash provided by operating activities 4,026 2,981 2,801
======= ======= =======
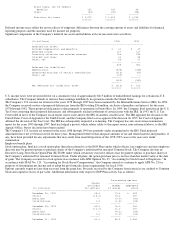
Cash flows provided by (used for)
investing activities:
Additions to property, plant and
equipment (3,550) (2,441) (1,933)
Purchases of long-term,
available-for-sale investments (129) (975) (1,165)
Sales of long-term,
available-for-sale investments 114 10 5
Maturities and other changes in
available-for-sale investments, net 878 503 (244)
------- ------- -------
Net cash (used for) investing activities (2,687) (2,903) (3,337)
======= ======= =======
Cash flows provided by (used for)
financing activities:
(Decrease) increase in short-term
debt, net (179) (63) 197
Additions to long-term debt -- 128 148
Retirement of long-term debt (4) (98) --
Proceeds from sales of shares through
employee stock plans and other 192 150 133
Proceeds from sale of Step-Up