IHOP 2015 Annual Report Download - page 111
Download and view the complete annual report
Please find page 111 of the 2015 IHOP annual report below. You can navigate through the pages in the report by either clicking on the pages listed below, or by using the keyword search tool below to find specific information within the annual report.-
 1
1 -
2
-
3
-
4
-
5
-
6
-
7
-
8
-
9
-
10
-
11
-
12
-
13
-
14
-
15
-
16
-
17
-
18
-
19
-
20
-
21
-
22
-
23
-
24
-
25
-
26
-
27
-
28
-
29
-
30
-
31
-
32
-
33
-
34
-
35
-
36
-
37
-
38
-
39
-
40
-
41
-
42
-
43
-
44
-
45
-
46
-
47
-
48
-
49
-
50
-
51
-
52
-
53
-
54
-
55
-
56
-
57
-
58
-
59
-
60
-
61
-
62
-
63
-
64
-
65
-
66
-
67
-
68
-
69
-
70
-
71
-
72
-
73
-
74
-
75
-
76
-
77
-
78
-
79
-
80
-
81
-
82
-
83
-
84
-
85
-
86
-
87
-
88
-
89
-
90
-
91
-
92
-
93
-
94
-
95
-
96
-
97
-
98
-
99
-
100
-
 101
101 -
 102
102 -
 103
103 -
 104
104 -
 105
105 -
 106
106 -
 107
107 -
 108
108 -
 109
109 -
 110
110 -
 111
111 -
 112
112 -
 113
113 -
 114
114 -
 115
115 -
 116
116 -
 117
117 -
 118
118 -
 119
119 -
 120
120
 |
 |

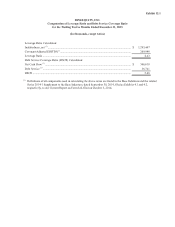
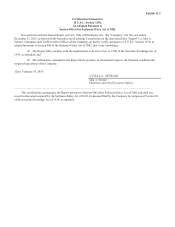
Exhibit 12.1
DINEEQUITY, INC.
Computation of Leverage Ratio and Debt Service Coverage Ratio
for the Trailing Twelve Months Ended December 31, 2015
(In thousands, except ratios)
Leverage Ratio Calculation:
Indebtedness, net (1) .................................................................................................................... $ 1,283,447
Covenant Adjusted EBITDA(1)................................................................................................... 289,948
Leverage Ratio ........................................................................................................................... 4.43
Debt Service Coverage Ratio (DSCR) Calculation:
Net Cash Flow (1)........................................................................................................................ $ 306,618
Debt Service (1) ........................................................................................................................... 56,741
DSCR ......................................................................................................................................... 5.40
(1) Definitions of all components used in calculating the above ratios are found in the Base Indenture and the related
Series 2014-1 Supplement to the Base Indenture, dated September 30, 2014, filed as Exhibits 4.1 and 4.2,
respectively, to our Current Report on Form 8-K filed on October 3, 2014.