IBM 2011 Annual Report Download - page 49
Download and view the complete annual report
Please find page 49 of the 2011 IBM annual report below. You can navigate through the pages in the report by either clicking on the pages listed below, or by using the keyword search tool below to find specific information within the annual report.-
 1
1 -
2
-
3
-
4
-
5
-
6
-
7
-
8
-
9
-
10
-
11
-
12
-
13
-
14
-
15
-
16
-
17
-
18
-
19
-
20
-
21
-
22
-
23
-
24
-
25
-
26
-
27
-
28
-
29
-
30
-
31
-
32
-
33
-
34
-
35
-
36
-
37
-
38
-
 39
39 -
 40
40 -
 41
41 -
 42
42 -
 43
43 -
 44
44 -
 45
45 -
 46
46 -
 47
47 -
 48
48 -
 49
49 -
 50
50 -
 51
51 -
 52
52 -
 53
53 -
 54
54 -
 55
55 -
 56
56 -
 57
57 -
 58
58 -
 59
59 -
60
-
61
-
62
-
63
-
64
-
65
-
66
-
67
-
68
-
69
-
70
-
71
-
72
-
73
-
74
-
75
-
76
-
77
-
78
-
79
-
80
-
81
-
82
-
83
-
84
-
85
-
86
-
87
-
88
-
89
-
90
-
91
-
92
-
93
-
94
-
95
-
96
-
97
-
98
-
99
-
100
-
101
-
102
-
103
-
104
-
105
-
106
-
107
-
108
-
109
-
110
-
111
-
112
-
113
-
114
-
115
-
116
-
117
-
118
-
119
-
120
-
121
-
122
-
123
-
124
-
125
-
126
-
127
-
128
-
129
-
130
-
131
-
132
-
133
-
134
-
135
-
136
-
137
-
138
-
139
-
140
-
141
-
142
-
143
-
144
-
145
-
146
-
147
-
148
 |
 |

47
Management Discussion
International Business Machines Corporation and Subsidiary Companies
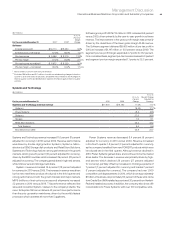
Global Services
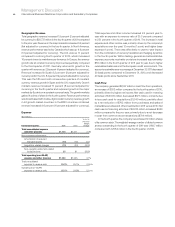
The Global Services segments, GTS and GBS, delivered combined
revenue of $56,424 million, an increase of 2.6 percent (1 percent
adjusted for currency) in 2010 when compared to 2009. Services
revenue performance at constant currency improved over the course
of 2010 led by the transaction businesses. In the first and second
quarter, revenue, adjusted for currency, decreased 2 percent
and increased 1 percent, respectively, versus the prior year periods.
In the third and fourth quarters, revenue increased 2 percent,
at constant currency, in each period. The estimated Global
Global Technology Services revenue of $38,201 million increased
2.3 percent (1 percent adjusted for currency) in 2010 versus 2009.
The rate of year-to-year revenue growth, adjusted for currency,
demonstrated an improving trend over the second half of 2010.
In the first half, revenue, adjusted for currency, was flat versus the
prior year, and in the second half, revenue increased 1 percent, at
constant currency, compared to the prior year period. GTS Outsourcing
revenue increased 2.9 percent (1 percent adjusted for currency) in
2010 with fairly consistent year-to-year growth, adjusted for currency,
throughout the year. Revenue growth was led by performance in the
growth markets, up 18.4 percent (8 percent adjusted for currency),
as the outsourcing offerings help clients build out their IT infrastructures.
Integrated Technology Services (ITS) revenue decreased 0.6 percent
(2 percent adjusted for currency) in 2010 versus 2009. ITS revenue
performance, adjusted for currency, improved over the course of 2010
and the growth markets had good year-to-year growth, up 8 percent
at constant currency, throughout 2010. Maintenance revenue increased
4.2 percent (3 percent adjusted for currency) compared to 2009 with
consistent performance, at constant currency, throughout the year.
Global Business Services revenue increased 3.2 percent
(2 percent adjusted for currency) in 2010 and delivered growth
in outsourcing and in the transactional businesses: consulting
and systems integration. Revenue growth was strongest in North
America, up 8.5 percent (7 percent adjusted for currency) and was
broad based across the industry sectors with Financial Services,
Distribution, Industrial, Public and General Business each delivering
growth on a constant currency basis. GBS had good performance
in its growth initiatives in 2010, with revenue and transactional
signings growth in the growth markets and revenue growth of over
35 percent in business analytics. GBS added over 4,000 consultants
in 2010 and had over 7,800 dedicated consultants in its business
analytics practice at the end of 2010.
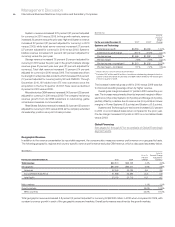
Services backlog at actual currency rates was $142 billion at
December 31, 2010, an increase of $5 billion ($4 billion adjusted for
currency) compared to the December 31, 2009 level. Backlog for
the outsourcing businesses at actual currency rates was estimated
to be $97 billion at December 31, 2010, an increase of $3 billion
($1 billion adjusted for currency) from December 31, 2009. The
Global Services segments delivered a combined pre-tax profit of
$8,044 million in 2010, a growth of 0.8 percent versus 2009 with a
pre-tax margin of 13.7 percent, down 0.2 points year to year.
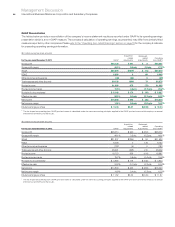
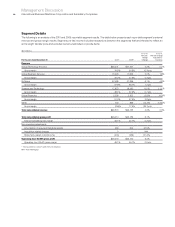
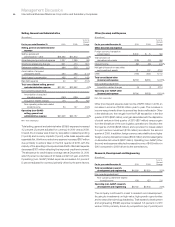
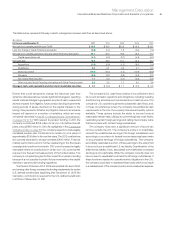
($ in millions)
For the year ended December 31: 2010*2009*
Yr.-to-Yr.
Percent/
Margin
Change
Global Services
Global Technology Services
External gross profit $13,194 $13,014 1.4%
External gross profit margin 34.5% 34.8% (0.3) pts.
Pre-tax income $ 5,499 $ 5,482 0.3%
Pre-tax margin 13.9% 14.2%(0.2) pts.
Pre-tax income—normalized** $ 5,771 $ 5,516 4.6%
Pre-tax margin—normalized 14.6% 14.2%0.4 pts.
Global Business Services
External gross profit $ 5,106 $ 4,902 4.2%
External gross profit margin 28.0% 27.8%0.3 pts.
Pre-tax income $ 2,546 $ 2,501 1.8%
Pre-tax margin 13.4%13.5%(0.1) pts.
Pre-tax income—normalized+$ 2,674 $ 2,577 3.7%
Pre-tax margin—normalized 14.1%13.9%0.2 pts.
* Reclassified to conform with 2011 presentation.
** Excludes $273 million and $115 million of workforce rebalancing charges in the first
quarter of 2010 and 2009, respectively, and ($81) million related to the Geodis gain
in the first quarter of 2009.
+
Excludes $128 million and $123 million of workforce rebalancing charges in the first
quarter of 2010 and 2009, respectively, and ($46) million related to the Geodis gain
in the first quarter of 2009.
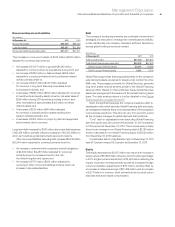
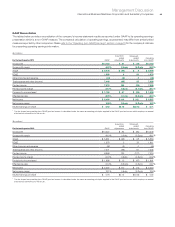
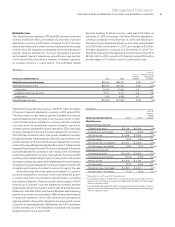
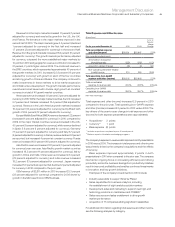
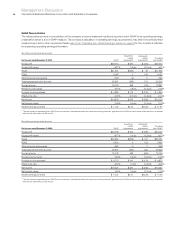
($ in millions)
For the year ended December 31: 2010 2009
Yr.-to-Yr.
Percent
Change
Yr.-to-Yr.
Percent Change
Adjusted for
Currency
Global Services external revenue $56,424 $55,000 2.6%1.0%
Global Technology Services $38,201 $37,347 2.3%0.7%
Outsourcing 22,241 21,620 2.9 1.1
Integrated Technology Services 8,714 8,771 (0.6)(1.8)
Maintenance 7,250 6,956 4.2 2.6
Global Business Services $18,223 $17,653 3.2%1.6%