IBM 2000 Annual Report Download - page 4
Download and view the complete annual report
Please find page 4 of the 2000 IBM annual report below. You can navigate through the pages in the report by either clicking on the pages listed below, or by using the keyword search tool below to find specific information within the annual report.-
 1
1 -
 2
2 -
 3
3 -
 4
4 -
 5
5 -
 6
6 -
 7
7 -
 8
8 -
 9
9 -
 10
10 -
 11
11 -
 12
12 -
 13
13 -
 14
14 -
 15
15 -
16
-
17
-
18
-
19
-
20
-
21
-
22
-
23
-
24
-
25
-
26
-
27
-
28
-
29
-
30
-
31
-
32
-
33
-
34
-
35
-
36
-
37
-
38
-
39
-
40
-
41
-
42
-
43
-
44
-
45
-
46
-
47
-
48
-
49
-
50
-
51
-
52
-
53
-
54
-
55
-
56
-
57
-
58
-
59
-
60
-
61
-
62
-
63
-
64
-
65
-
66
-
67
-
68
-
69
-
70
-
71
-
72
-
73
-
74
-
75
-
76
-
77
-
78
-
79
-
80
-
81
-
82
-
83
-
84
-
85
-
86
-
87
-
88
-
89
-
90
-
91
-
92
-
93
-
94
-
95
-
96
-
97
-
98
-
99
-
100
 |
 |
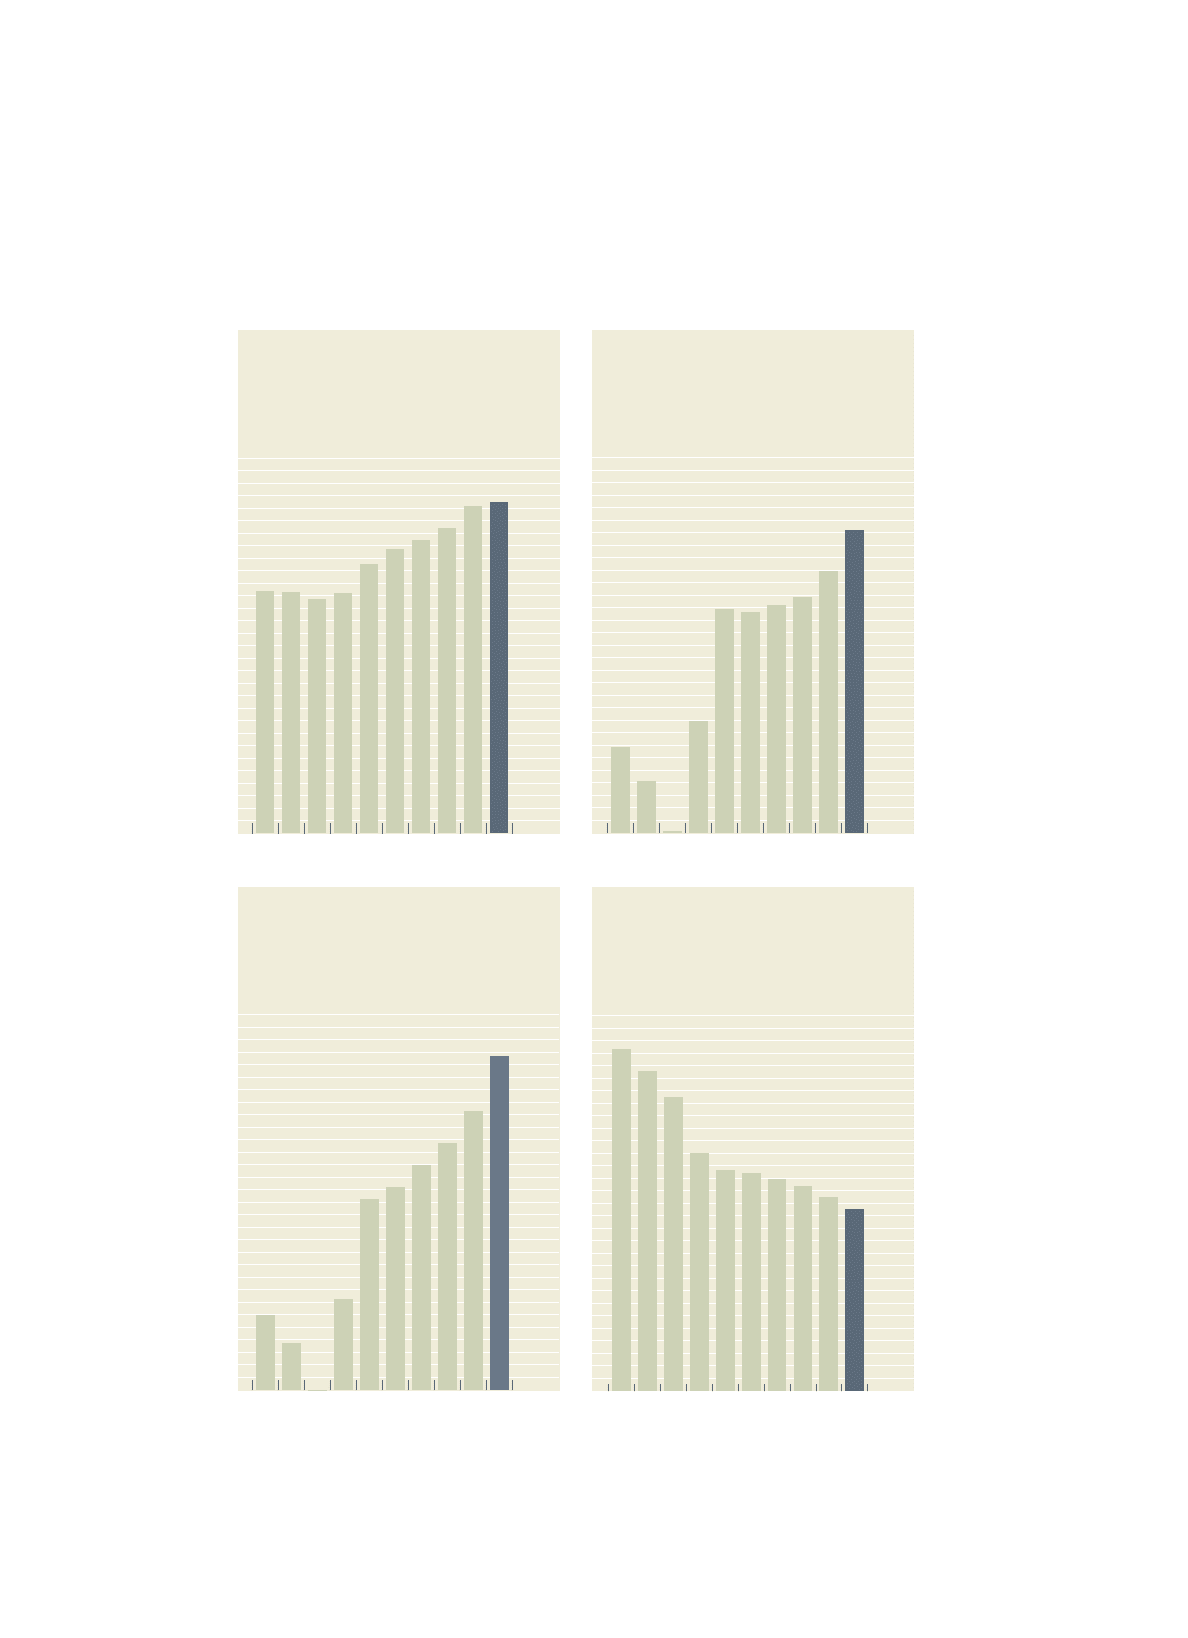
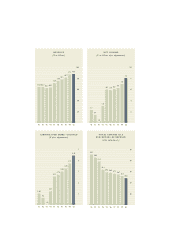
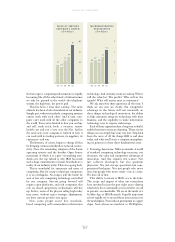
64.8 64.5 62.7
75.9 78.5
81.7
87.5 88.4
64.1
71.9
91 92 93 94 95 96 97 98 99 00
20
40
60
80
100
2
4
6
8
10
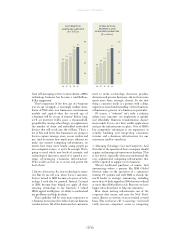
2.3
1. 4
.01
5.9 6.1 6.3
7. 0
8.1
3.0
6.0
91 92 93 94 95 96 97 98 99 00
1
2
3
4
5
-.02
1.00
.62
2.71
3.00
3.29
3.72
4.44
1.24
2.55
91 92 93 94 95 96 97 98 99 00
earnings per share
—
diluted
($ after adjustments)
revenue
($ in billions)
net income
($ in billions after adjustments)
10
20
30
40
50
91 92 93 94 95 96 97 98 99 00
44.5
41.6
38.3
31.4
28.8 28.3 27.5 26.7
25.3
23.6
total expense as a
percentage of revenue
(after adjustments)