Hormel Foods 2014 Annual Report Download - page 5
Download and view the complete annual report
Please find page 5 of the 2014 Hormel Foods annual report below. You can navigate through the pages in the report by either clicking on the pages listed below, or by using the keyword search tool below to find specific information within the annual report.-
 1
1 -
 2
2 -
 3
3 -
 4
4 -
 5
5 -
 6
6 -
 7
7 -
 8
8 -
 9
9 -
 10
10 -
 11
11 -
 12
12 -
 13
13 -
 14
14 -
 15
15 -
 16
16 -
17
-
18
-
19
-
20
-
21
-
22
-
23
-
24
-
25
-
26
-
27
-
28
-
29
-
30
-
31
-
32
-
33
-
34
-
35
-
36
-
37
-
38
-
39
-
40
-
41
-
42
-
43
-
44
-
45
-
46
-
47
-
48
-
49
-
50
-
51
-
52
-
53
-
54
-
55
-
56
-
57
-
58
-
59
-
60
-
61
-
62
-
63
-
64
-
65
-
66
-
67
-
68
 |
 |

2014 annual report 3
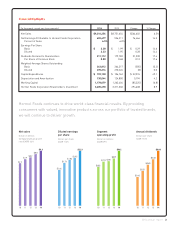
Financial highlights
Hormel Foods continues to drive world-class fi nancial results. By providing
consumers with valued, innovative products across our portfolio of trusted brands,
we will continue to deliver growth.
1413121110
Net sales
Dollars in billions
Compound annual growth
rate (CAGR) 6.6%
$7.2
$7.9 $8.2
$8.8
$9.3
1413121110
Diluted earnings
per share
Dollars per share
CAGR 11.2%
$1.46
$1.74
$1.86
$1.95
$2.23
1413121110
Segment
operating profit
Dollars in millions
CAGR 8.9%
$683
$773 $781
$829
$962
1413121110
Annual dividends
Dollars per share
CAGR 17.5%
$0.42
$0.51
$0.60
$0.68
$0.80
(In thousands, except per share amounts) 2014 2013 Change % Change
Net Sales $9,316,256 $8,751,654 $564,602 6.5%
Net Earnings Attributable to Hormel Foods Corporation 602,677 526,211 76,466 14.5
Percent of Sales 6.5% 6.0%
Earnings Per Share
Basic $ 2.28 $ 1.99 $ 0.29 14.6
Diluted 2.23 1.95 0.28 14.4
Dividends Declared to Shareholders 211,112 179,782 31,330 17.4
Per Share of Common Stock 0.80 0.68 0.12 17.6
Weighted-Average Shares Outstanding
Basic 263,812 264,317 (505) (0.2)
Diluted 270,216 270,224 (8) 0.0
Capital Expenditures $ 159,138 $ 106,762 $ 52,376 49.1
Depreciation and Amortization 130,044 124,850 5,194 4.2
Working Capital 1,178,079 1,263,404 (85,325) (6.8)
Hormel Foods Corporation Shareholders’ Investment 3,605,678 3,311,040 294,638 8.9