Honeywell 2006 Annual Report Download - page 126
Download and view the complete annual report
Please find page 126 of the 2006 Honeywell annual report below. You can navigate through the pages in the report by either clicking on the pages listed below, or by using the keyword search tool below to find specific information within the annual report.-
 1
1 -
2
-
3
-
4
-
5
-
6
-
7
-
8
-
9
-
10
-
11
-
12
-
13
-
14
-
15
-
16
-
17
-
18
-
19
-
20
-
21
-
22
-
23
-
24
-
25
-
26
-
27
-
28
-
29
-
30
-
31
-
32
-
33
-
34
-
35
-
36
-
37
-
38
-
39
-
40
-
41
-
42
-
43
-
44
-
45
-
46
-
47
-
48
-
49
-
50
-
51
-
52
-
53
-
54
-
55
-
56
-
57
-
58
-
59
-
60
-
61
-
62
-
63
-
64
-
65
-
66
-
67
-
68
-
69
-
70
-
71
-
72
-
73
-
74
-
75
-
76
-
77
-
78
-
79
-
80
-
81
-
82
-
83
-
84
-
85
-
86
-
87
-
88
-
89
-
90
-
91
-
92
-
93
-
94
-
95
-
96
-
97
-
98
-
99
-
100
-
101
-
102
-
103
-
104
-
105
-
106
-
107
-
108
-
109
-
110
-
111
-
112
-
113
-
114
-
115
-
 116
116 -
 117
117 -
 118
118 -
 119
119 -
 120
120 -
 121
121 -
 122
122 -
 123
123 -
 124
124 -
 125
125 -
 126
126 -
 127
127 -
 128
128 -
 129
129 -
 130
130 -
 131
131 -
 132
132 -
 133
133 -
 134
134 -
 135
135 -
 136
136 -
137
-
138
-
139
-
140
-
141
-
142
-
143
-
144
-
145
-
146
-
147
-
148
-
149
-
150
-
151
-
152
-
153
-
154
-
155
-
156
-
157
-
158
-
159
-
160
-
161
-
162
-
163
-
164
-
165
-
166
-
167
-
168
-
169
-
170
-
171
-
172
-
173
-
174
-
175
-
176
-
177
-
178
-
179
-
180
-
181
-
182
-
183
-
184
-
185
-
186
-
187
-
188
-
189
-
190
-
191
-
192
-
193
-
194
-
195
-
196
-
197
-
198
-
199
-
200
-
201
-
202
-
203
-
204
-
205
-
206
-
207
-
208
-
209
-
210
-
211
-
212
-
213
-
214
-
215
-
216
-
217
 |
 |

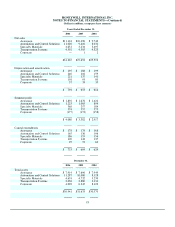
HONEYWELL INTERNATIONAL INC.
NOTES TO FINANCIAL STATEMENTS—(Continued)
(Dollars in millions, except per share amounts)
Years Ended December 31,
2006 2005 2004
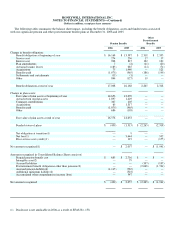
Net sales
Aerospace $11,124 $10,496 $ 9,740
Automation and Control Solutions 11,020 9,416 8,031
Specialty Materials 4,631 3,234 3,497
Transportation Systems 4,592 4,505 4,323
Corporate — 1 2
$31,367 $27,652 $25,593
Depreciation and amortization
Aerospace $ 195 $ 188 $ 199
Automation and Control Solutions 240 202 159
Specialty Materials 221 137 141
Transportation Systems 101 93 80
Corporate 37 33 35
$ 794 $ 653 $ 614
Segment profit
Aerospace $ 1,892 $ 1,676 $ 1,422
Automation and Control Solutions 1,223 1,065 894
Specialty Materials 568 257 184
Transportation Systems 574 557 575
Corporate (177) (173) (158)
$ 4,080 $ 3,382 $ 2,917
Capital expenditures
Aerospace $ 178 $ 178 $ 168
Automation and Control Solutions 165 136 106
Specialty Materials 186 155 156
Transportation Systems 109 143 137
Corporate 95 72 62
$ 733 $ 684 $ 629
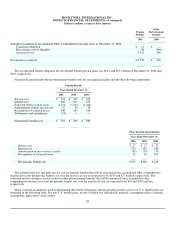
December 31,
2006 2005 2004
Total assets
Aerospace $ 7,914 $ 7,696 $ 7,949
Automation and Control Solutions 11,287 10,080 8,128
Specialty Materials 4,674 4,732 3,239
Transportation Systems 3,038 2,880 3,131
Corporate 4,028 6,245 8,123
$30,941 $31,633 $30,570
93