Home Shopping Network 2012 Annual Report Download - page 21
Download and view the complete annual report
Please find page 21 of the 2012 Home Shopping Network annual report below. You can navigate through the pages in the report by either clicking on the pages listed below, or by using the keyword search tool below to find specific information within the annual report.-
 1
1 -
2
-
3
-
4
-
5
-
6
-
7
-
8
-
9
-
10
-
 11
11 -
 12
12 -
 13
13 -
 14
14 -
 15
15 -
 16
16 -
 17
17 -
 18
18 -
 19
19 -
 20
20 -
 21
21 -
 22
22 -
 23
23 -
 24
24 -
 25
25 -
 26
26 -
 27
27 -
 28
28 -
 29
29 -
 30
30 -
 31
31 -
32
-
33
-
34
-
35
-
36
-
37
-
38
-
39
-
40
-
41
-
42
-
43
-
44
-
45
-
46
-
47
-
48
-
49
-
50
-
51
-
52
-
53
-
54
-
55
-
56
-
57
-
58
-
59
-
60
-
61
-
62
-
63
-
64
-
65
-
66
-
67
-
68
-
69
-
70
-
71
-
72
-
73
-
74
-
75
-
76
-
77
-
78
-
79
-
80
-
81
-
82
-
83
-
84
-
85
-
86
-
87
-
88
-
89
-
90
-
91
-
92
-
93
-
94
-
95
-
96
-
97
-
98
 |
 |

Table of Contents
During the quarter ended December 31, 2012, we repurchased approximately 676,000 shares at an average price of $49.20 per share.
Below is a summary of our common stock repurchases during the fourth quarter of 2012, as well as the number of shares still available for
purchase as of December 31, 2012:
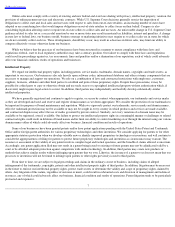
Performance Graph
The graph depicted below compares the performance of our common stock with the cumulative total return on the S&P 500 Retailing
Index and the Russell 2000 Index from August 12, 2008, the first day of trading of HSNi's common stock on the NASDAQ Global Select Market
after the Spin-off through December 31, 2012, the last day of our fiscal year.
*Assumes $100 invested on 8/12/08, including reinvestment of dividends.
17
Period
Number of
Shares Purchased
Average Price
Paid Per Share
Number of
Shares Purchased
as Part of Publicly
Announced Plans
or Programs
Maximum Number
of Shares that May
Yet Be Purchased
under the Plans or
Programs
October 1, 2012 - October 31, 2012
583,476
$
48.68
583,476
3,840,122
November 1, 2012 - November 30, 2012
3,800
$
51.87
3,800
3,836,322
December 1, 2012 - December 31, 2012
88,337
$
52.54
88,337
3,747,985
675,613
675,613
8/12/2008
12/31/2008
12/31/2009
12/31/2010
12/31/2011 12/31/2012
HSN, Inc.
100.00
66.70
185.23
281.19
333.87
513.66
S&P 500 Retailing Index
100.00
80.07
119.94
150.35
157.40
198.30
Russell 2000 Index
100.00
70.45
89.60
113.66
108.92
126.72