Hertz 2014 Annual Report Download - page 74
Download and view the complete annual report
Please find page 74 of the 2014 Hertz annual report below. You can navigate through the pages in the report by either clicking on the pages listed below, or by using the keyword search tool below to find specific information within the annual report.-
 1
1 -
2
-
3
-
4
-
5
-
6
-
7
-
8
-
9
-
10
-
11
-
12
-
13
-
14
-
15
-
16
-
17
-
18
-
19
-
20
-
21
-
22
-
23
-
24
-
25
-
26
-
27
-
28
-
29
-
30
-
31
-
32
-
33
-
34
-
35
-
36
-
37
-
38
-
39
-
40
-
41
-
42
-
43
-
44
-
45
-
46
-
47
-
48
-
49
-
50
-
51
-
52
-
53
-
54
-
55
-
56
-
57
-
58
-
59
-
60
-
61
-
62
-
63
-
 64
64 -
 65
65 -
 66
66 -
 67
67 -
 68
68 -
 69
69 -
 70
70 -
 71
71 -
 72
72 -
 73
73 -
 74
74 -
 75
75 -
 76
76 -
 77
77 -
 78
78 -
 79
79 -
 80
80 -
 81
81 -
 82
82 -
 83
83 -
 84
84 -
85
-
86
-
87
-
88
-
89
-
90
-
91
-
92
-
93
-
94
-
95
-
96
-
97
-
98
-
99
-
100
-
101
-
102
-
103
-
104
-
105
-
106
-
107
-
108
-
109
-
110
-
111
-
112
-
113
-
114
-
115
-
116
-
117
-
118
-
119
-
120
-
121
-
122
-
123
-
124
-
125
-
126
-
127
-
128
-
129
-
130
-
131
-
132
-
133
-
134
-
135
-
136
-
137
-
138
-
139
-
140
-
141
-
142
-
143
-
144
-
145
-
146
-
147
-
148
-
149
-
150
-
151
-
152
-
153
-
154
-
155
-
156
-
157
-
158
-
159
-
160
-
161
-
162
-
163
-
164
-
165
-
166
-
167
-
168
-
169
-
170
-
171
-
172
-
173
-
174
-
175
-
176
-
177
-
178
-
179
-
180
-
181
-
182
-
183
-
184
-
185
-
186
-
187
-
188
-
189
-
190
-
191
-
192
-
193
-
194
-
195
-
196
-
197
-
198
-
199
-
200
-
201
-
202
-
203
-
204
-
205
-
206
-
207
-
208
-
209
-
210
-
211
-
212
-
213
-
214
-
215
-
216
-
217
-
218
-
219
-
220
-
221
-
222
-
223
-
224
-
225
-
226
-
227
-
228
-
229
-
230
-
231
-
232
-
233
-
234
-
235
-
236
-
237
-
238
-
239
-
240
-
241
-
242
-
243
-
244
-
245
-
246
-
247
-
248
-
249
-
250
-
251
-
252
-
253
-
254
-
255
-
256
-
257
-
258
-
259
-
260
-
261
-
262
-
263
-
264
-
265
-
266
-
267
-
268
-
269
-
270
-
271
-
272
-
273
-
274
-
275
-
276
-
277
-
278
-
279
-
280
-
281
-
282
-
283
-
284
-
285
-
286
-
287
-
288
-
289
-
290
-
291
-
292
-
293
-
294
-
295
-
296
-
297
-
298
-
299
-
300
-
301
-
302
-
303
-
304
-
305
-
306
-
307
-
308
-
309
-
310
-
311
-
312
-
313
-
314
-
315
-
316
-
317
-
318
-
319
-
320
-
321
-
322
-
323
-
324
-
325
-
326
-
327
-
328
-
329
-
330
-
331
-
332
-
333
-
334
-
335
-
336
-
337
-
338
-
339
-
340
-
341
-
342
-
343
-
344
-
345
-
346
-
347
-
348
-
349
-
350
-
351
-
352
-
353
-
354
-
355
-
356
-
357
-
358
-
359
-
360
-
361
-
362
-
363
-
364
-
365
-
366
-
367
-
368
-
369
-
370
-
371
-
372
-
373
-
374
-
375
-
376
-
377
-
378
-
379
-
380
-
381
-
382
-
383
-
384
-
385
-
386
 |
 |

Table of Contents
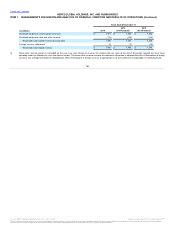
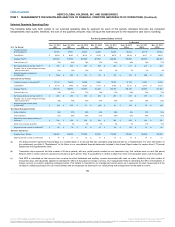
Transaction days (in thousands) 10,734
14,695
12,096
9,395
10,473
14,278
11,261
9,006
Average fleet 156,700
196,900
172,300
141,400
155,700
188,700
163,500
137,500
Number of days in period 92
92
91
90
92
92
91
90
Average fleet multiplied by number of
days in period (in thousands) 14,416
18,115
15,679
12,726
14,324
17,360
14,879
12,375
Fleet efficiency 74%
81%
77%
74%
73%
82%
76%
73%
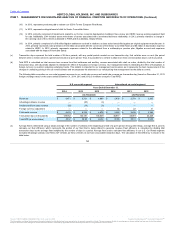
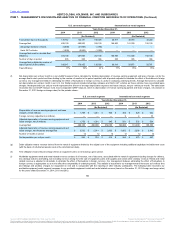
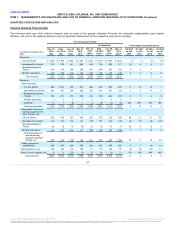
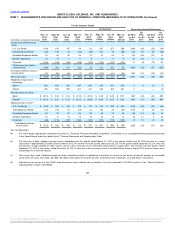
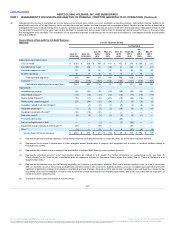
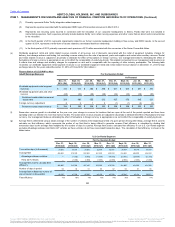
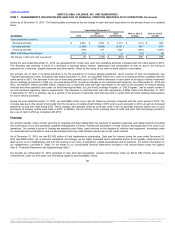
(h) Net depreciation per unit per month is a non-GAAP measure that is calculated by dividing depreciation of revenue earning equipment and lease charges, net by the
average fleet in each period and then dividing by the number of months in the period reported, with all periods adjusted to eliminate the effect of fluctuations in foreign
currency. Our management believes eliminating the effect of fluctuations in foreign currency is useful in analyzing underlying trends. Average fleet used to calculate
net depreciation per unit per month in our U.S. Car Rental segment includes Advantage sublease and Hertz 24/7 vehicles as these vehicles have associated lease
charges. Net depreciation per unit per month represents the amount of average depreciation expense and lease charges, net per vehicle per month. The table below
reconciles this non-GAAP measure to its most comparable GAAP measure, which is depreciation of revenue earning equipment and lease charges, net, (based on
December 31, 2013 foreign exchange rates) for the periods shown:
Depreciation of revenue earning
equipment and lease charges, net (in
millions) $ 533
$ 409
$ 391
$ 424
$ 337
$ 337
$ 323
$ 285
Average Fleet 486,900
515,300
502,500
491,500
490,200
516,800
499,000
454,000
Depreciation of revenue earning
equipment and lease charges, net
divided by average fleet $ 1,095
$ 794
$ 778
$ 863
$ 687
$ 652
$ 647
$ 628
Number of months in period 3
3
3
3
3
3
3
3
Net depreciation per unit per month $ 365
$ 265
$ 259
$ 288
$ 229
$ 217
$ 216
$ 209
Depreciation of revenue earning
equipment and lease charges, net (in
millions) $ 112
$ 143
$ 124
$ 113
$ 119
$ 151
$ 132
$ 125
Foreign currency adjustment (in
millions) 8
2
(1)
—
—
4
2
(1)
Adjusted depreciation of revenue
earning equipment and lease charges,
net (in millions) $ 120
$ 145
$ 123
$ 113
$ 119
$ 155
$ 134
$ 124
Average Fleet 156,700
196,900
172,300
141,400
155,700
188,700
163,500
137,500
Adjusted depreciation of revenue
earning equipment and lease charges,
net divided by average fleet $ 766
$ 736
$ 714
$ 799
$ 764
$ 821
$ 820
$ 902
Number of months in period 3
3
3
3
3
3
3
3
Net depreciation per unit per month $ 255
$ 245
$ 238
$ 266
$ 255
$ 274
$ 273
$ 301
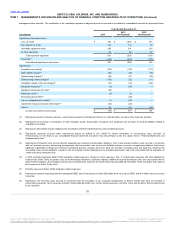
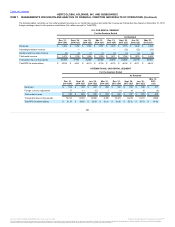
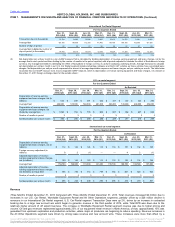
Total revenues increased $4 million due to
increases in our U.S. Car Rental, Worldwide Equipment Rental and All Other Operations segments, partially offset by a $26 million decline in
revenues in our International Car Rental segment. U.S. Car Rental segment Transaction Days were up 2%, driven by an increase in contracted
booking due to a large new account win which began to generate revenue in the third quarter of 2014, while Total RPD was down due to the
relatively higher amount of off airport business. The increase in Worldwide Equipment Rental segment revenue was due to higher pricing and
volume. Oil and gas revenues represented approximately 25% of our equipment rental revenue in North America, of that, approximately 15% was
generated from upstream exploration and production activities, where major oil producers are beginning to reduce spending. Revenue increases in
the All Other Operations segment were driven by strong lease revenue and new account wins. These increases were more than offset by a
Source: HERTZ GLOBAL HOLDINGS INC, 10-K, July 16, 2015 Powered by Morningstar® Document Research℠
The information contained herein may not be copied, adapted or distributed and is not warranted to be accurate, complete or timely. The user assumes all risks for any damages or losses arising from any use of this information,
except to the extent such damages or losses cannot be limited or excluded by applicable law. Past financial performance is no guarantee of future results.